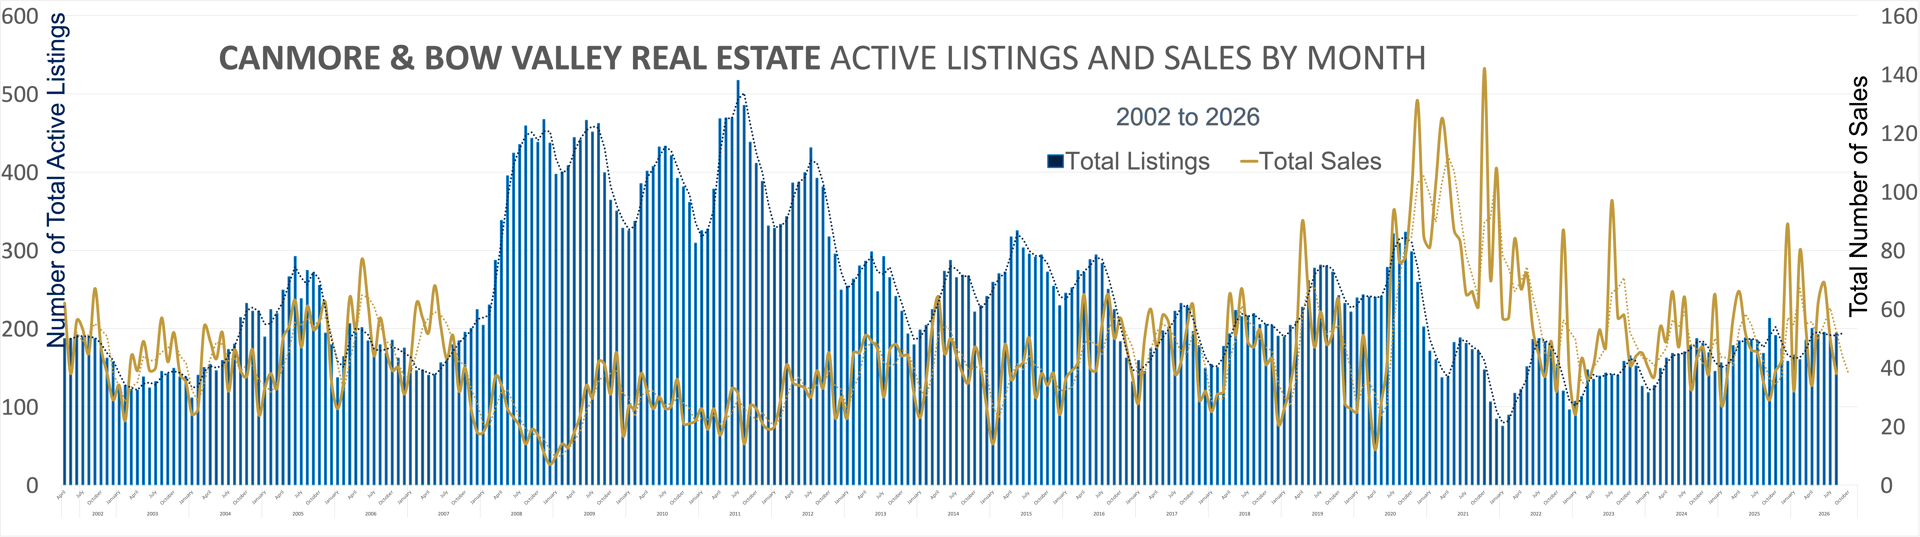
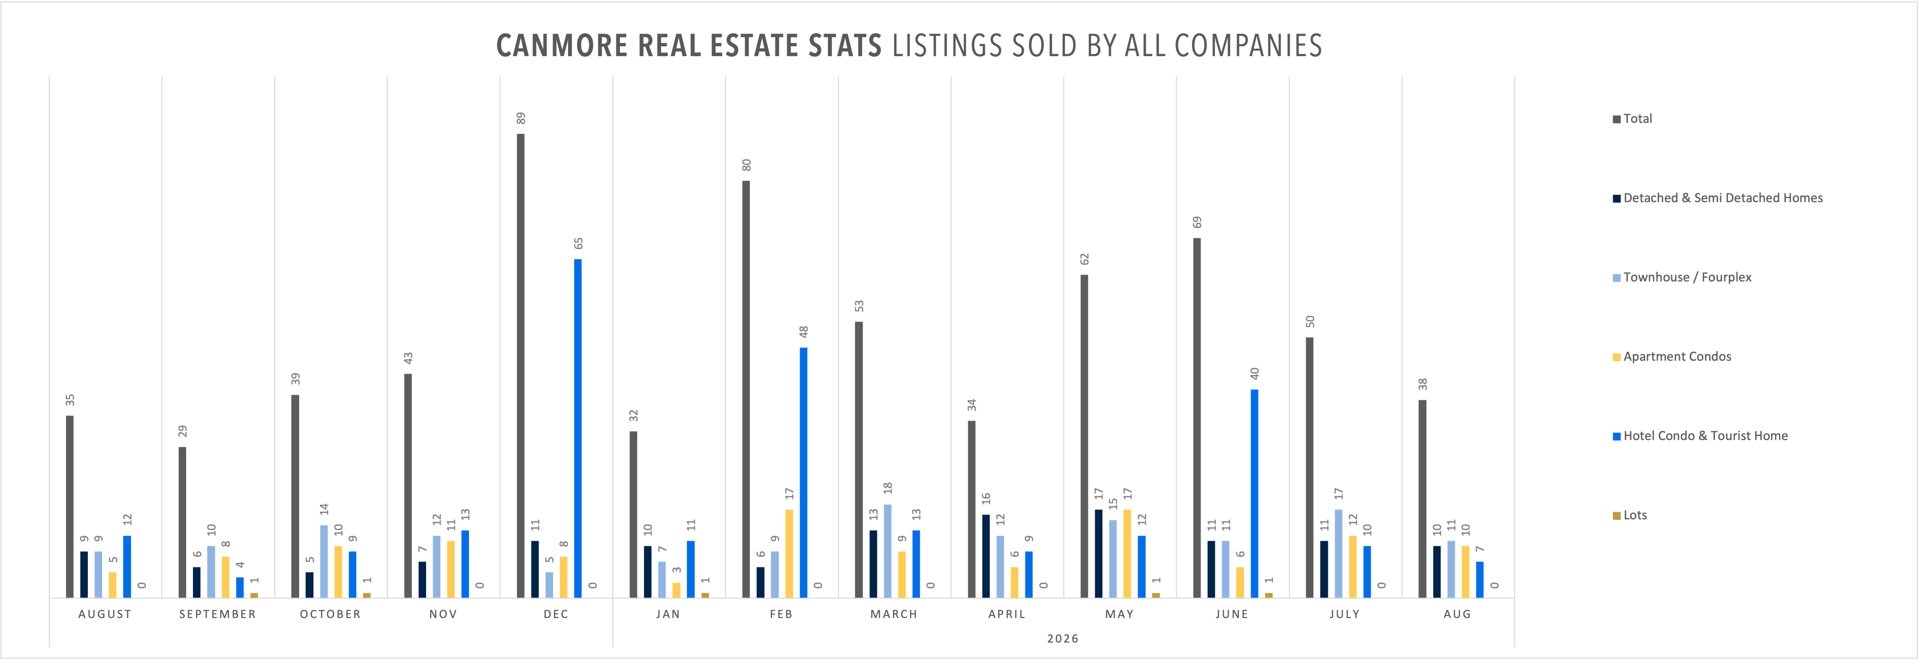
August posted 38 sales, down from July’s 50 but still modestly ahead of August 2025’s 35. On the surface, that looks like the market catching its breath after July’s residential rebound — and it is, partly. Residential sales (detached, townhome, and apartment condo combined) pulled back from July’s 40 to 31 in August, but that’s still up nearly 35% from August 2025’s 23. Short-term rentals kept cooling, down to 7 sales — the segment’s quietest month in over a year.
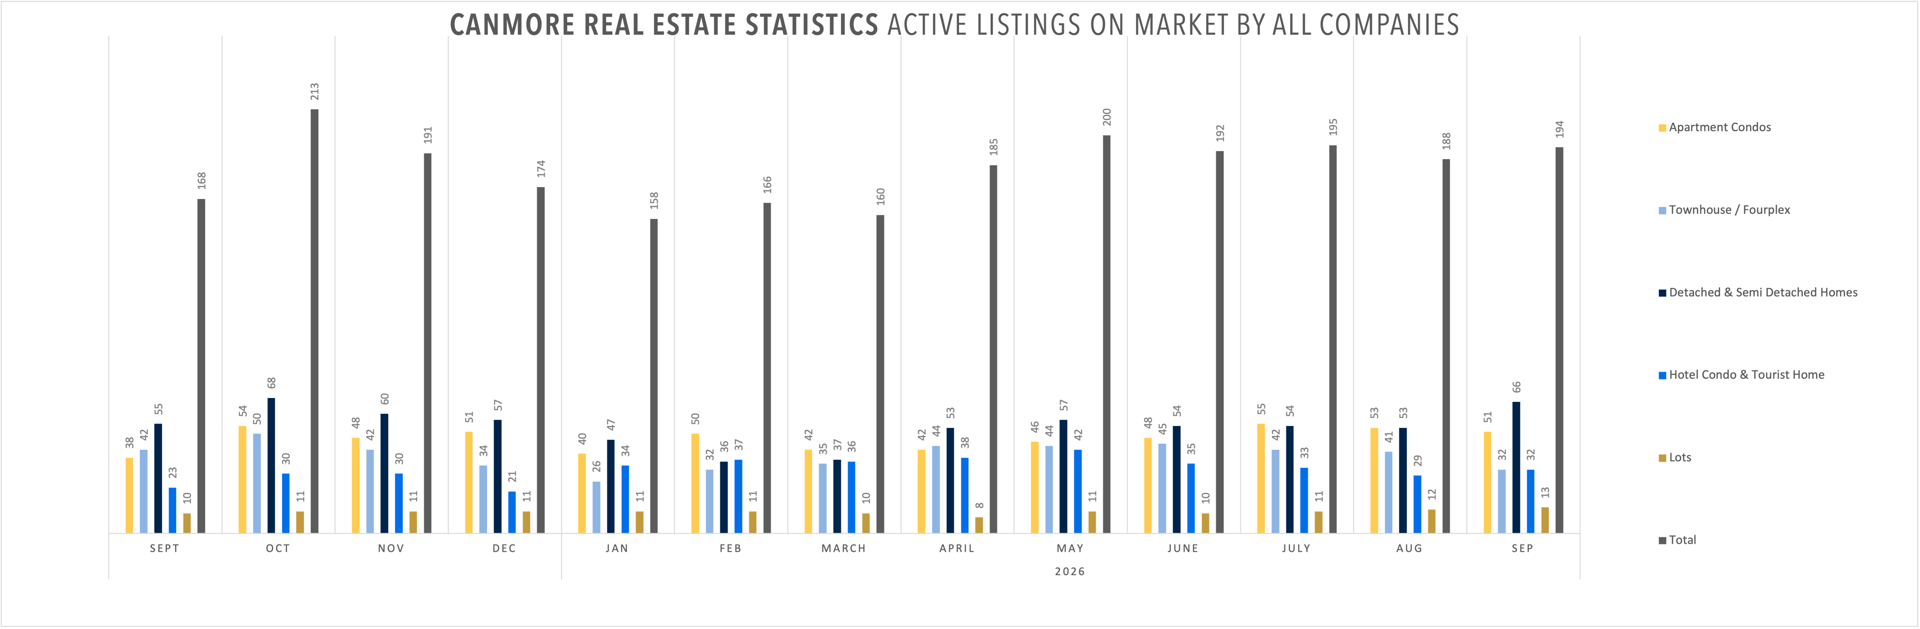
Inventory did what it usually does heading into fall: it grew. Active listings climbed to 194 by early September, up from 188 in August. That’s normal seasonal behaviour, not a red flag on its own — but it’s worth noting this year’s total is running about 15% ahead of last September’s 168. Dig into the segments, though, and the “more inventory” headline hides a real split: detached and apartment condo listings both jumped noticeably heading into fall, while townhome listings actually kept shrinking. This is a market doing several different things at once, which is exactly the kind of month where the segment-by-segment detail matters more than any single headline number.
Sales Activity: Residential Cools From July’s Peak, Still Well Ahead of Last Year
August’s 38 total sales sit below July’s 50, but July was an unusually strong residential month, so some pullback was expected. Residential sales (detached, townhome, and apartment condo combined) came in at 31 for August — down 22.5% from July’s 40, but up 34.8% from August 2025’s 23. Short-term rental sales fell to 7, down 30% from July’s 10 and down 41.7% from August 2025’s 12 — the segment’s lowest monthly count since the spring, and for the first time this year, below where it sat a year earlier.
Active listings across all property types rose from 188 in August to 194 as of early September, up 3.2% month over month and 15.5% year over year. Year to date (January through August), residential sales sit at 274 versus 265 a year ago — up a modest 3.4%, the first time in 2026 the YTD residential comparison has been solidly positive rather than essentially flat. Short-term rentals remain up sharply for the year (150 versus 96, up 56.2%), though that gap is almost entirely a function of February’s and June’s project-driven spikes rather than anything happening in the market right now.
Detached & Semi-Detached Homes: Steady Sales, a Notable Listing Jump
Ten detached and semi-detached homes sold in August, close to July’s 11 and up modestly from August 2025’s 9. The more interesting move is on the supply side: active listings jumped from 53 in August to 66 by early September — up 24.5% in a single month, and up 20% from a year ago. That’s a sharp one-month increase, though it lines up with the seasonal pattern of sellers listing for the fall market rather than anything unusual; new listings typically pick up this time of year across the Bow Valley.
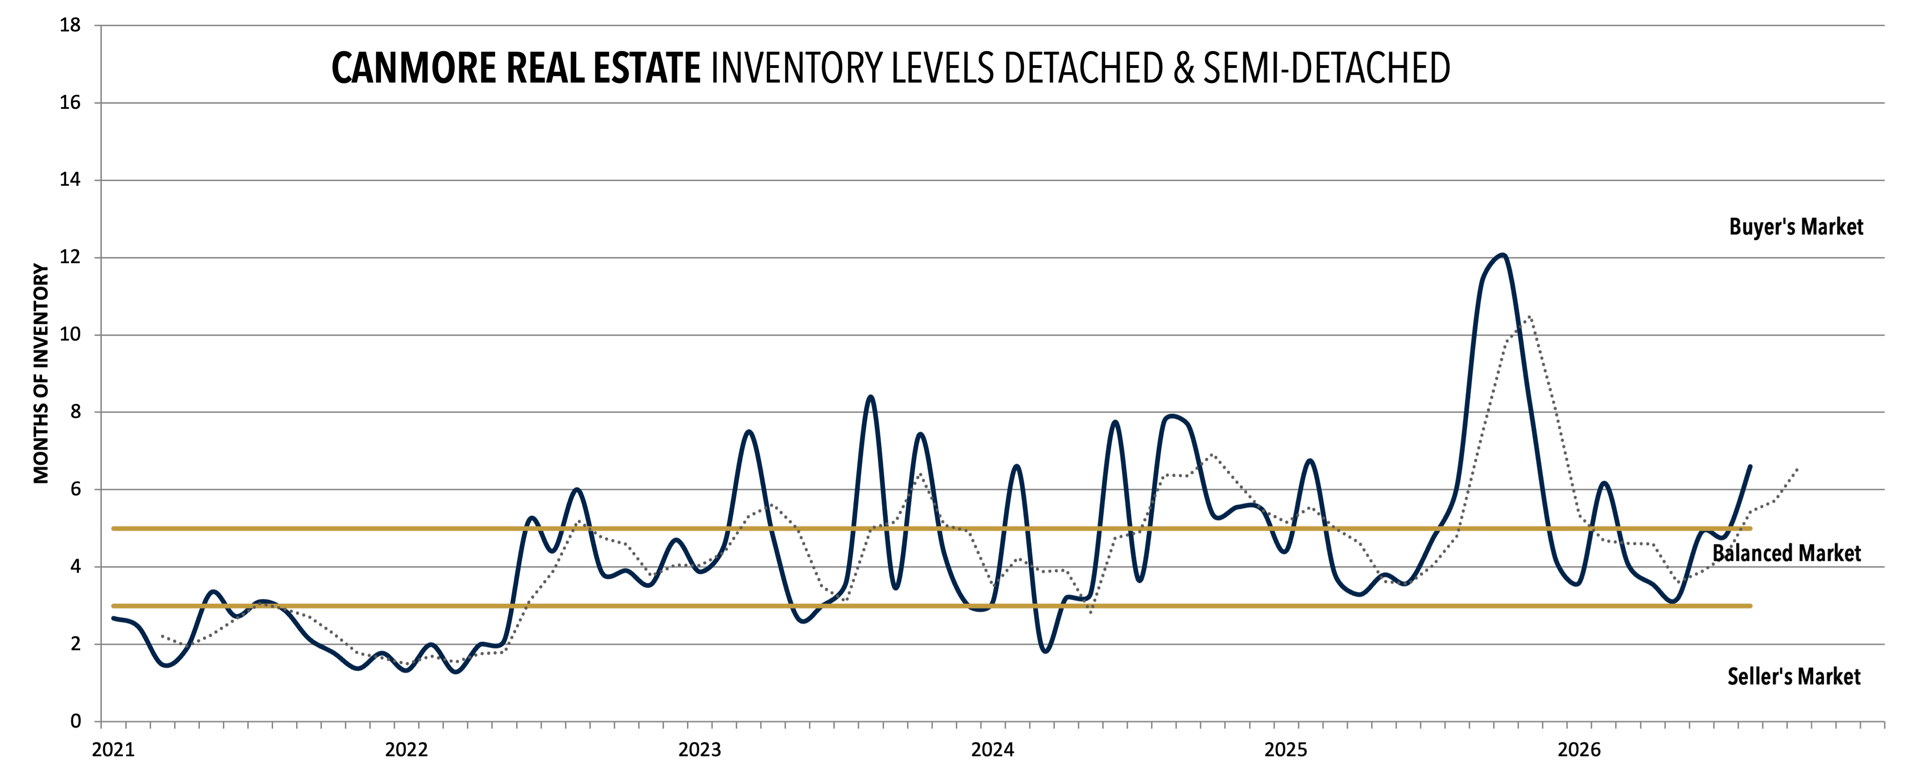
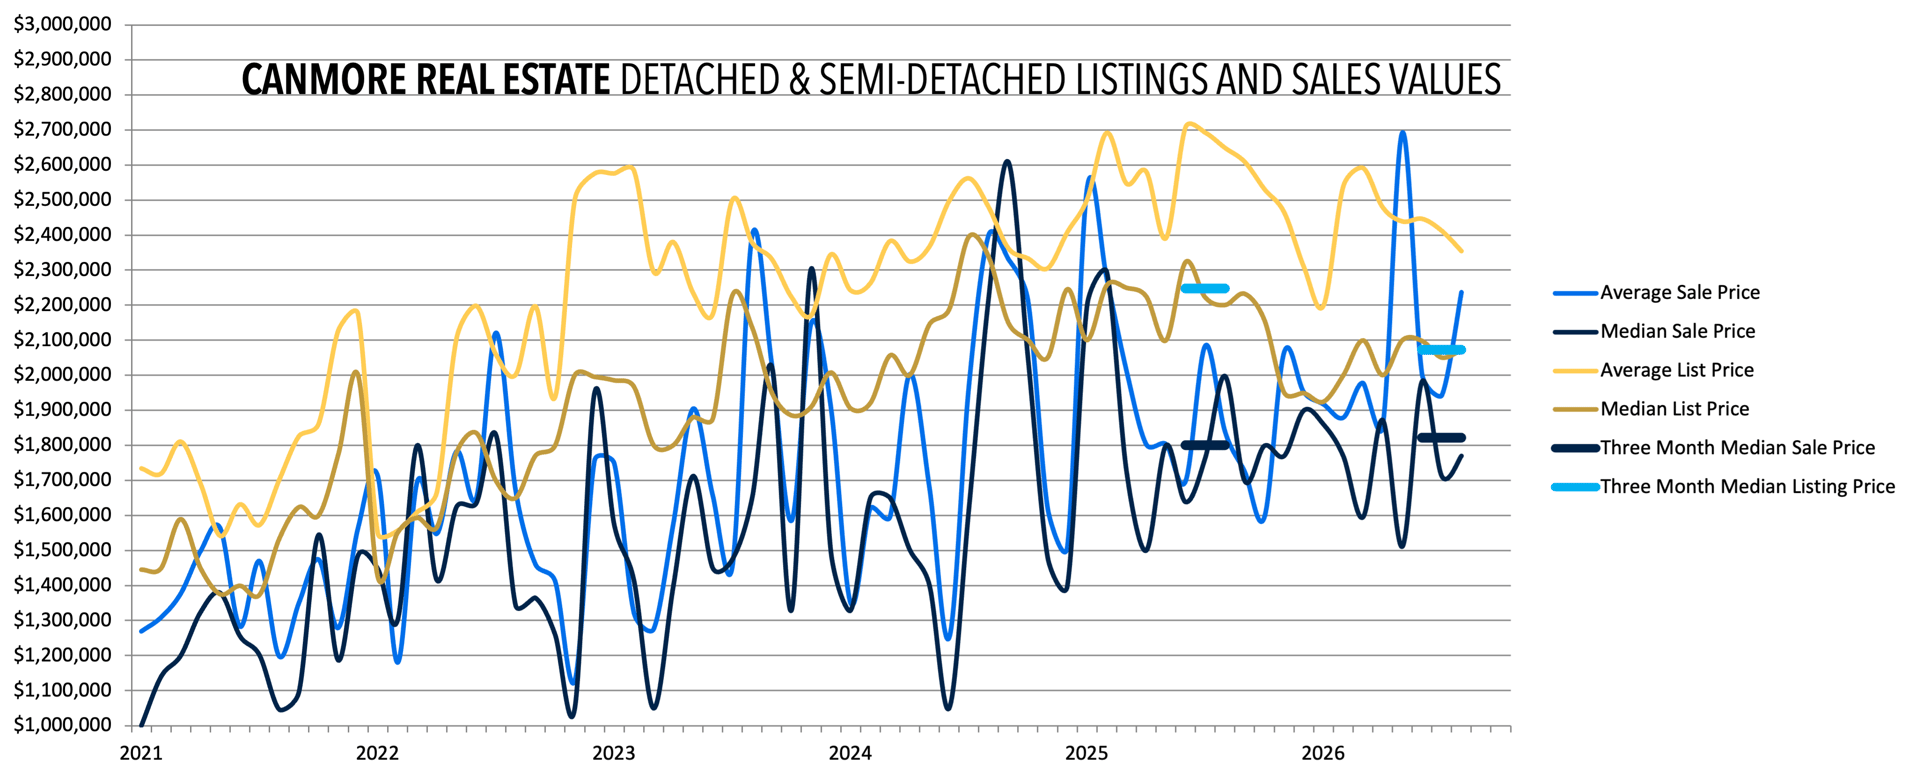
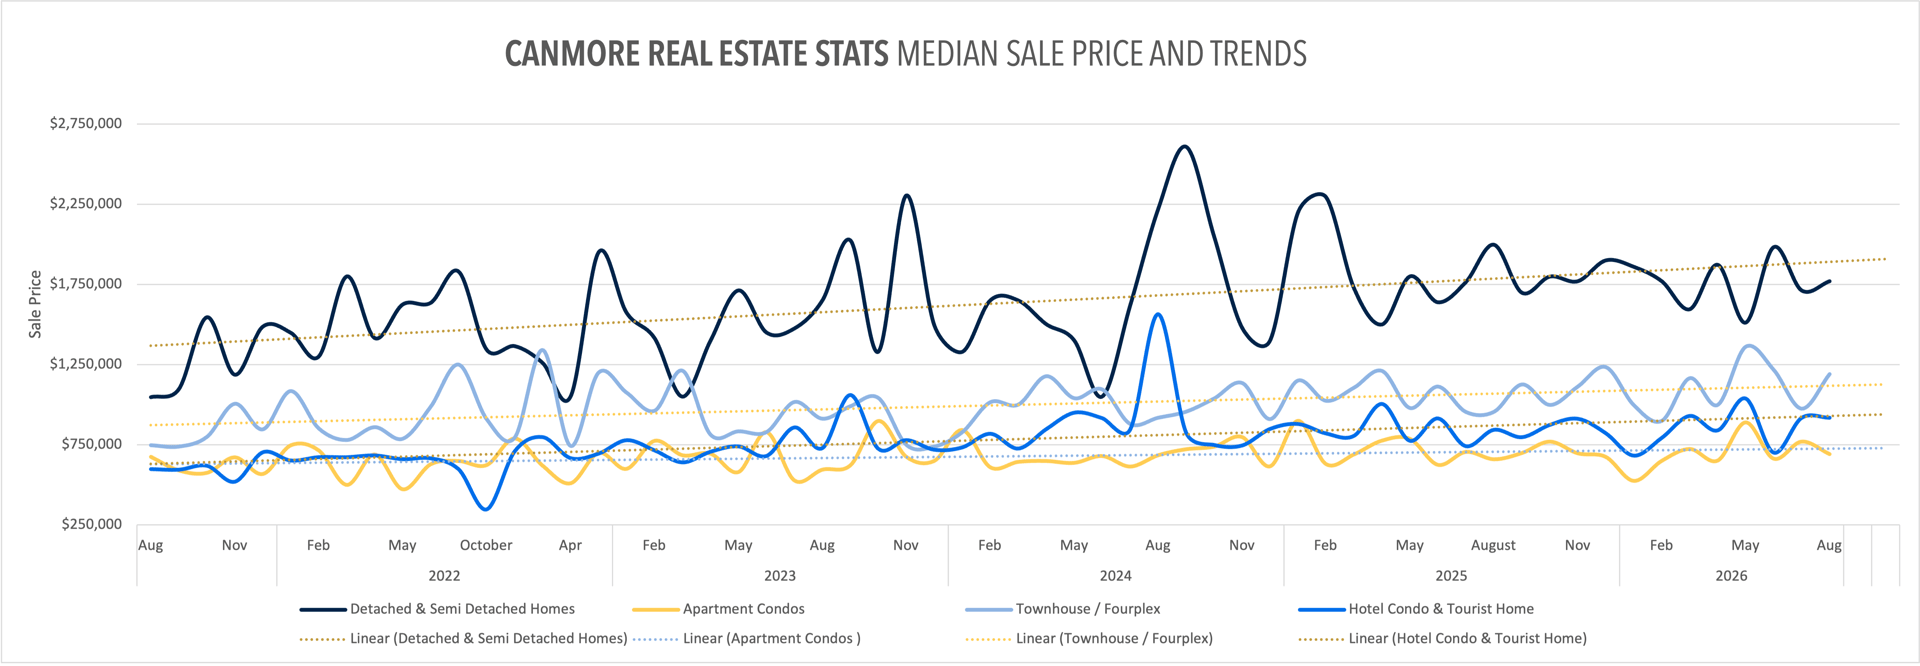
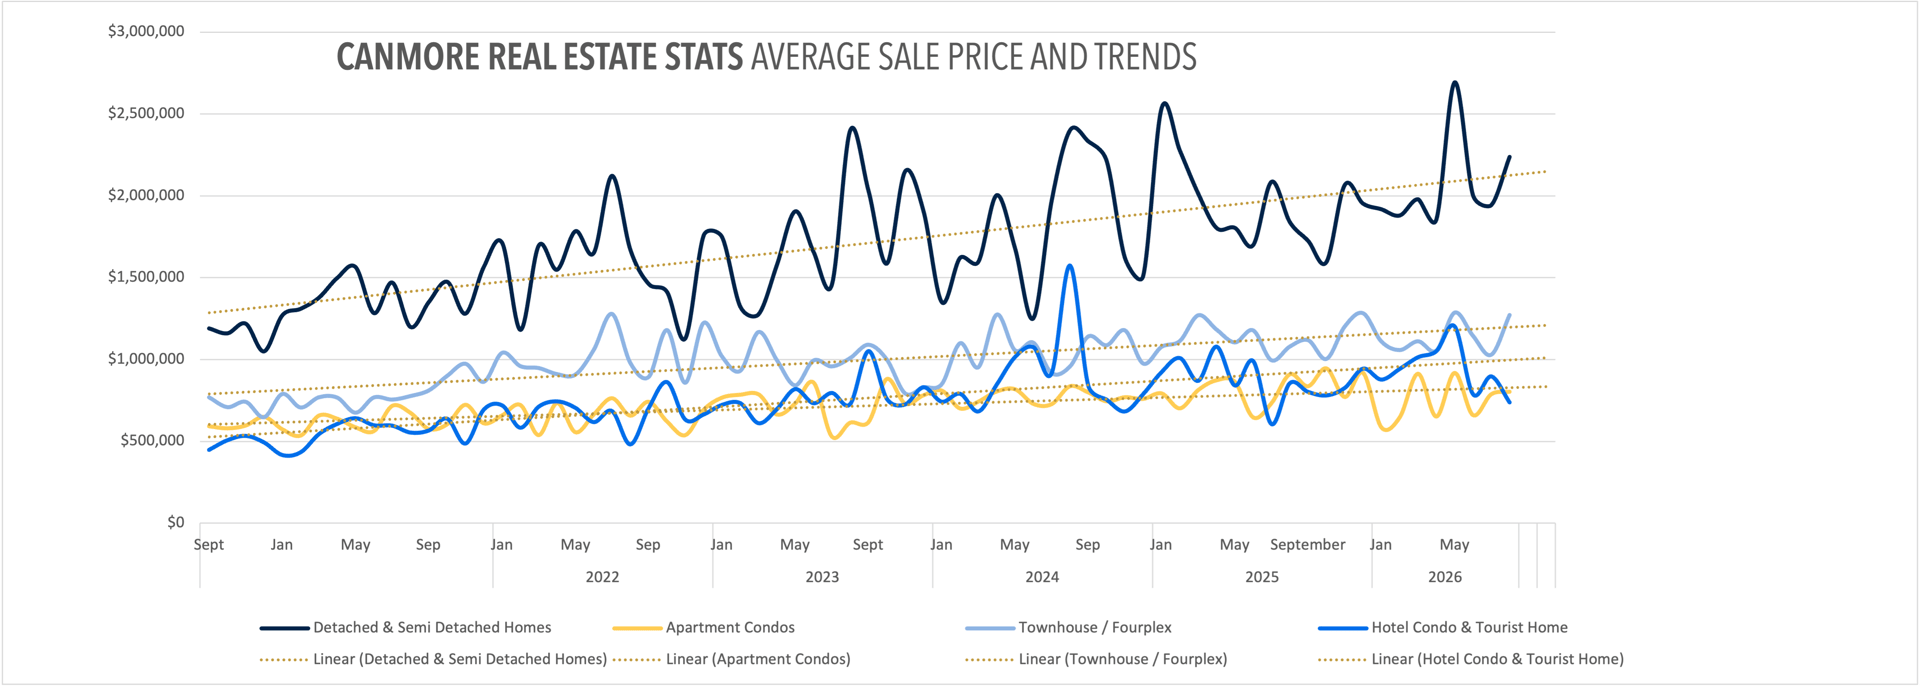
Pricing softened both month over month and year over year: the median sale price came in at $1,770,000, up slightly from July’s $1,712,500 but down about 11% from August 2025’s $1,998,000. Asking prices have eased too — the median list price on active detached listings sits at $2,049,950 heading into September, down from $2,097,500 in August and about 7.7% below where it sat a year ago. With months-of-inventory at roughly 5.3 (up from July’s 4.9), this segment is drifting from balanced toward more buyer-friendly territory as fall listings arrive — worth watching over the next month or two to see if sales keep pace with the new supply.
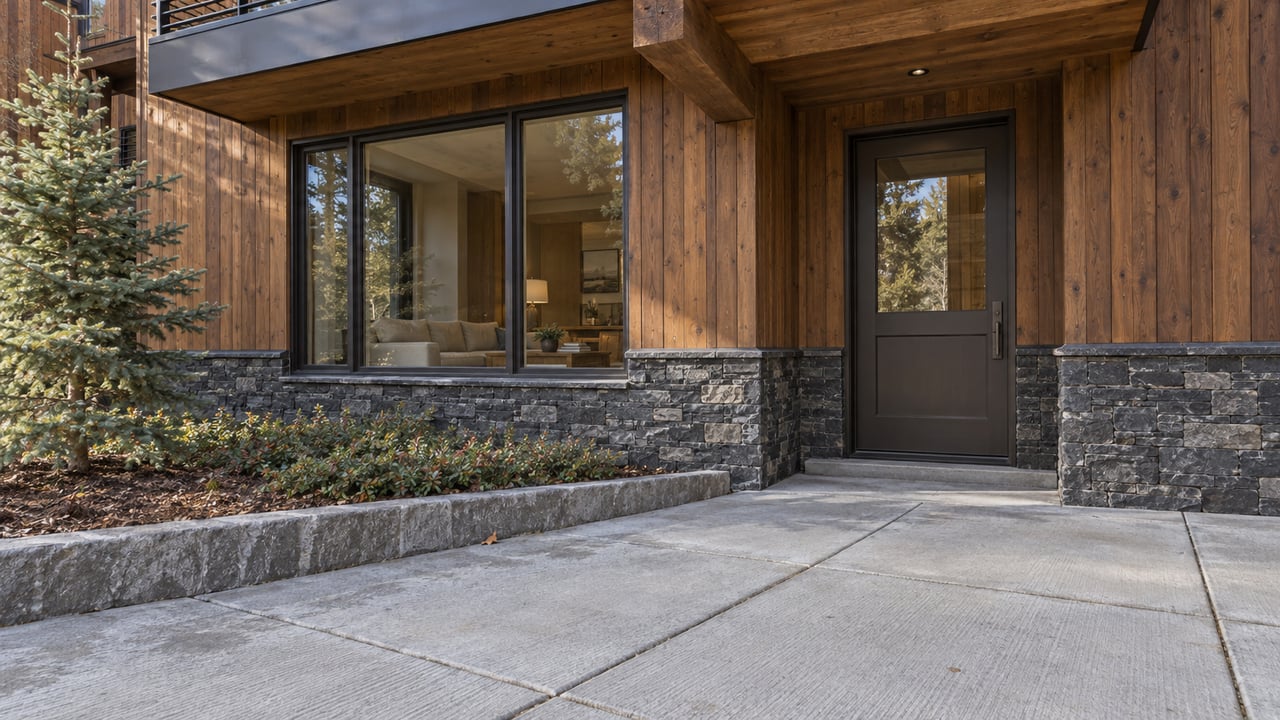
Worth flagging separately: this summer also saw the successful launch of Cadence Pond at Silvertip, with strong uptake from buyers. That activity doesn’t show up in the resale statistics above, but it’s a good reminder that headline MLS numbers don’t capture everything happening in Canmore’s higher end — there’s real appetite for well-conceived new construction even in a month where resale detached pricing cooled.
Apartment Condos: Sales Still Way Up Year Over Year, Pricing Pulls Back From July
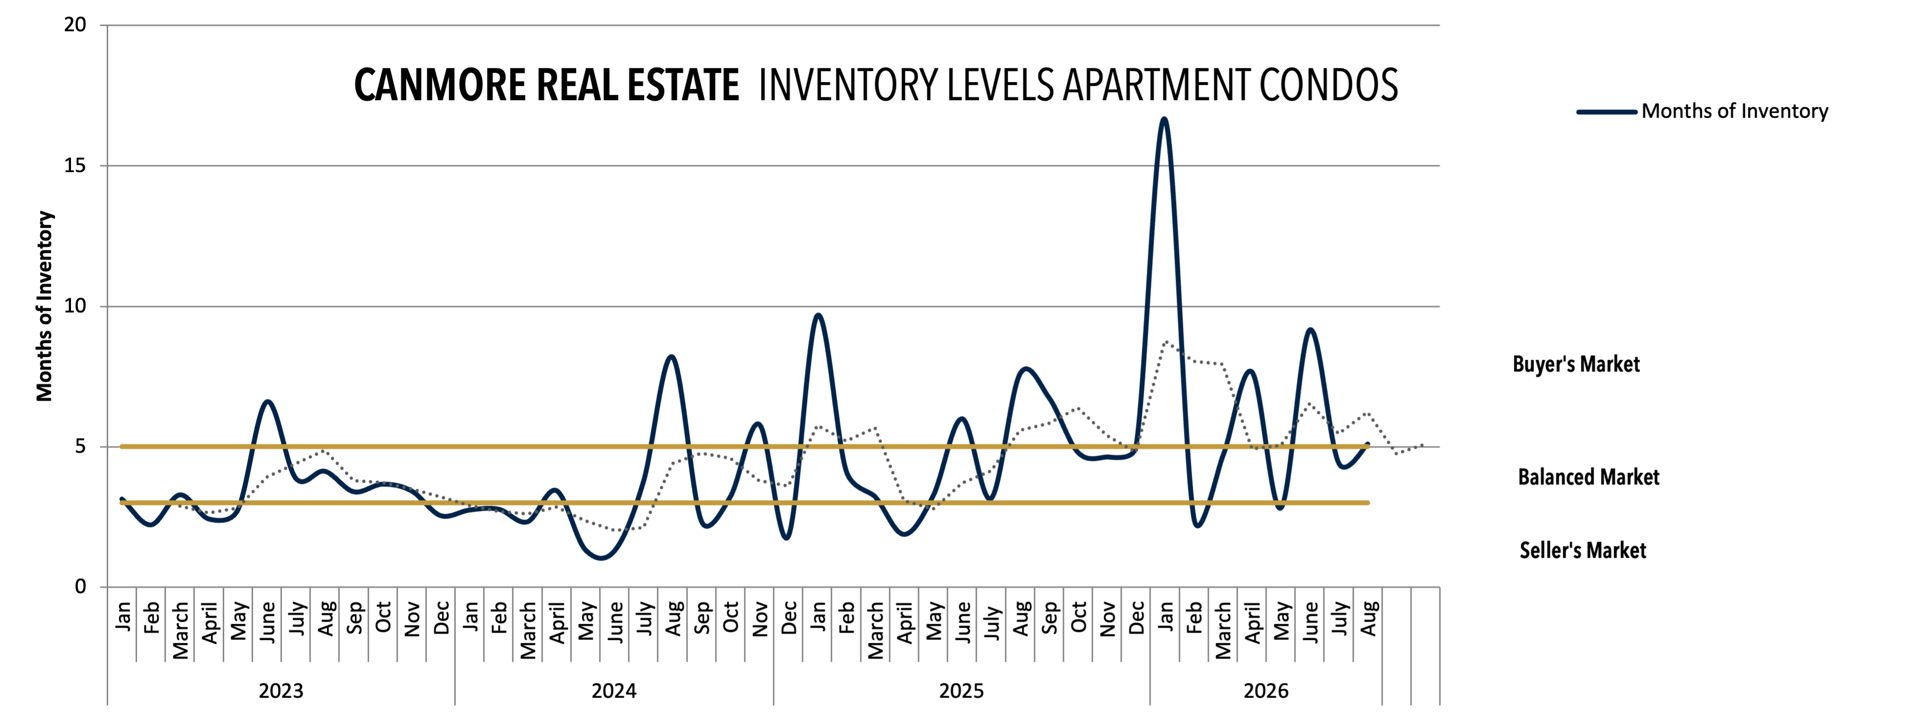
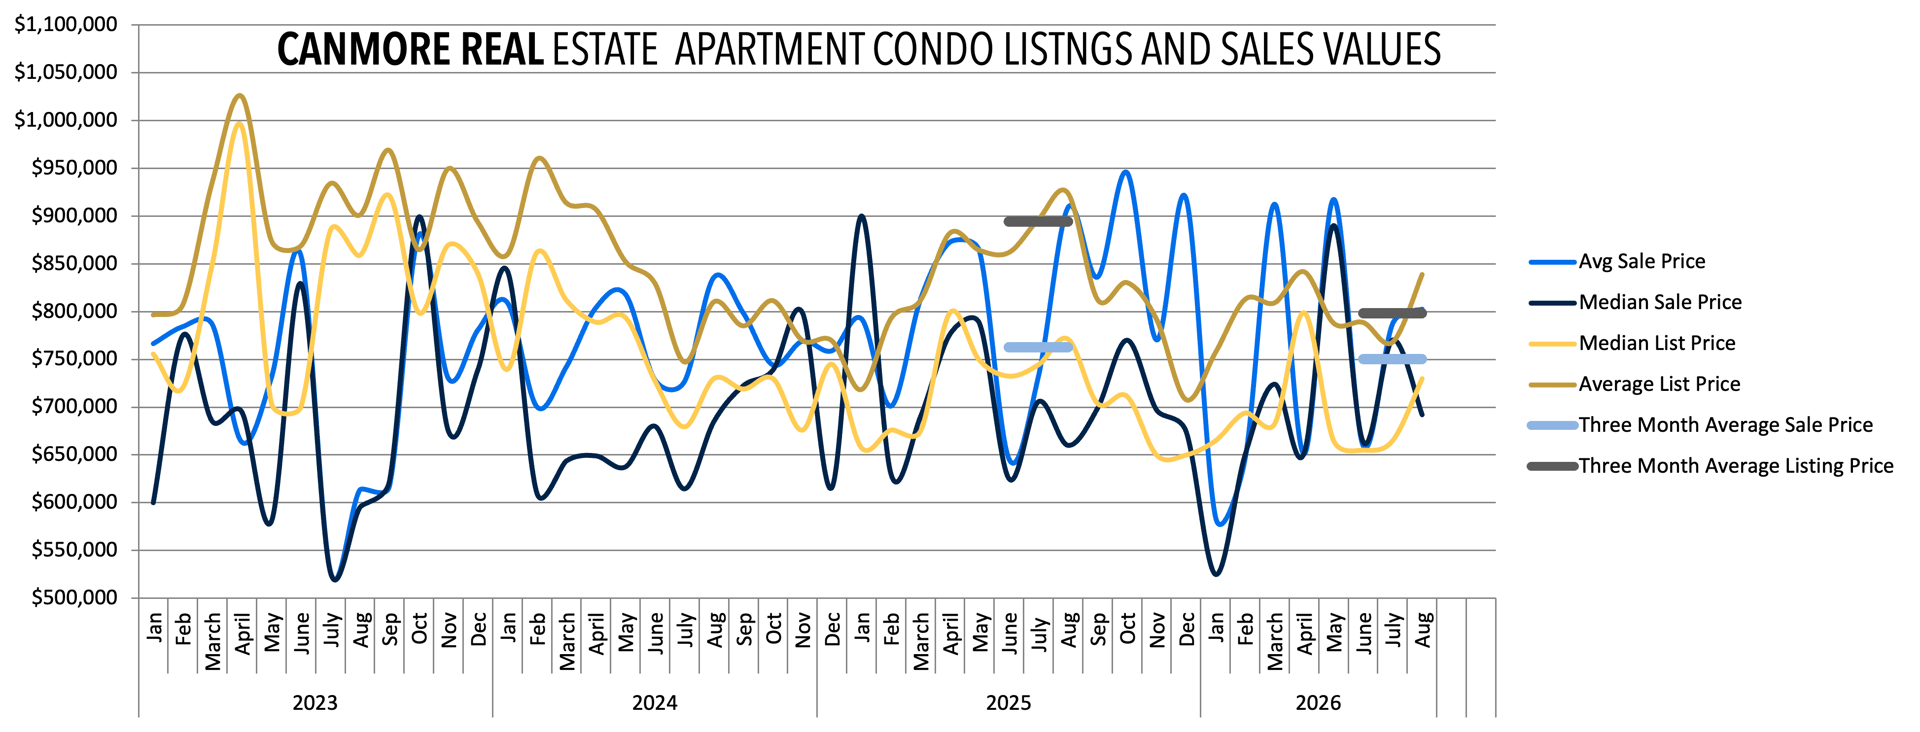
Apartment condos sold 10 units in August, down from July’s 12 but double August 2025’s 5 — still the standout year-over-year comparison of any segment this month. Active listings held essentially steady, easing slightly from 53 to 51 by early September, but that’s still up 34.2% from a year ago, reflecting how much supply has come into this segment through 2026.
Pricing pulled back after July’s high: the median sale price was $692,000 in August, down about 10% from July’s $770,250, though still up modestly (4.8%) from August 2025’s $660,000. Months-of-inventory sits at roughly 5.3, a touch looser than July’s 4.6 but dramatically tighter than August 2025’s 7.6 — this segment has absorbed a full year’s worth of new-construction supply and is still transacting at a healthier pace than it was twelve months ago.
Townhomes: The Only Segment Where Supply Is Actually Shrinking
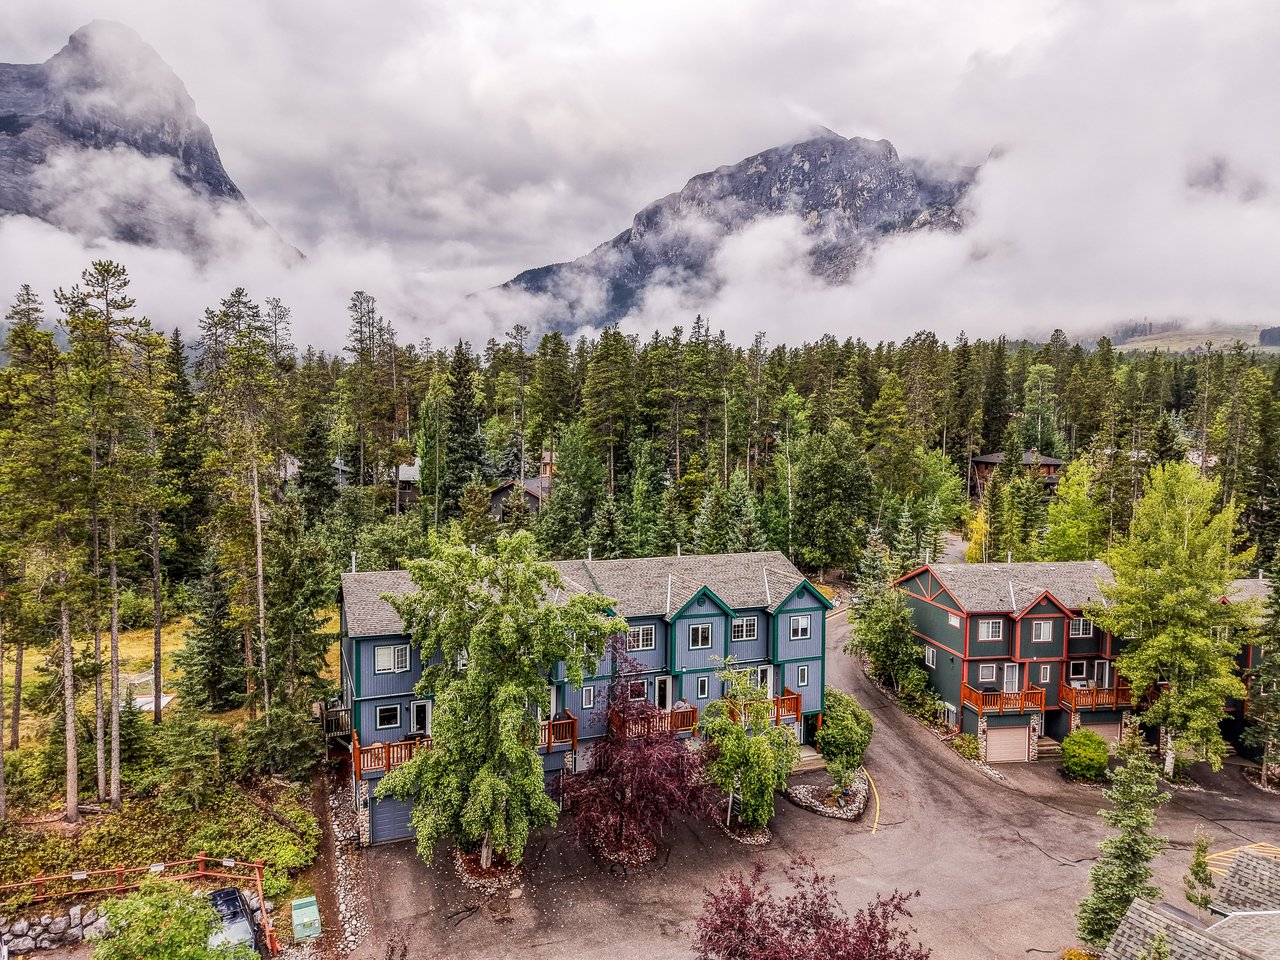
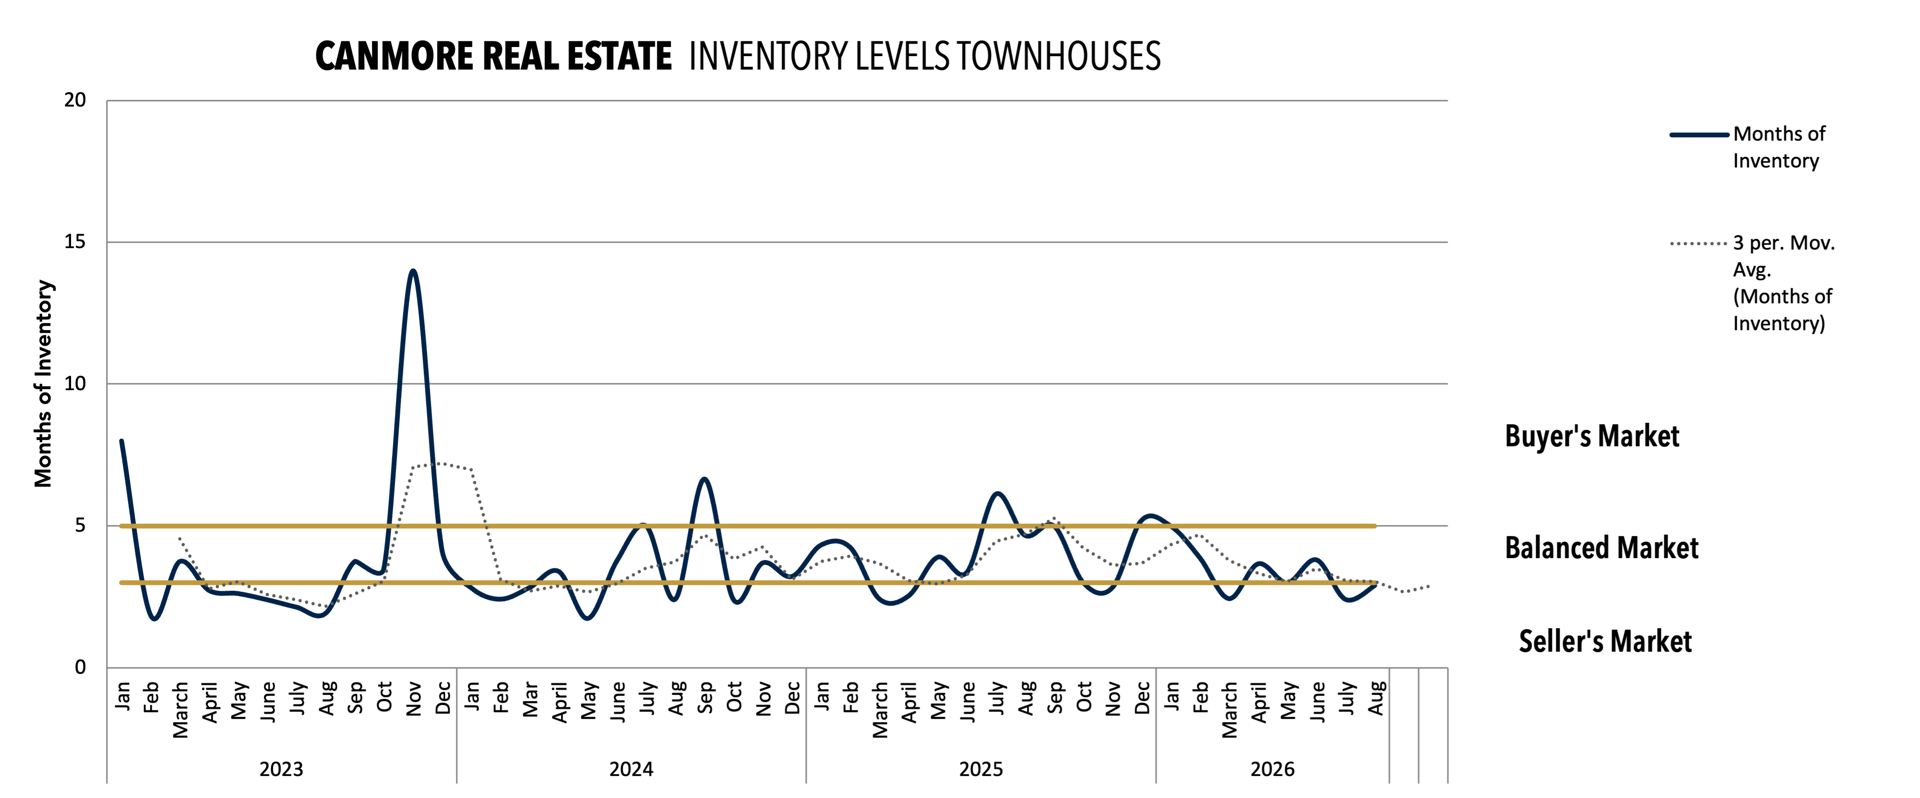
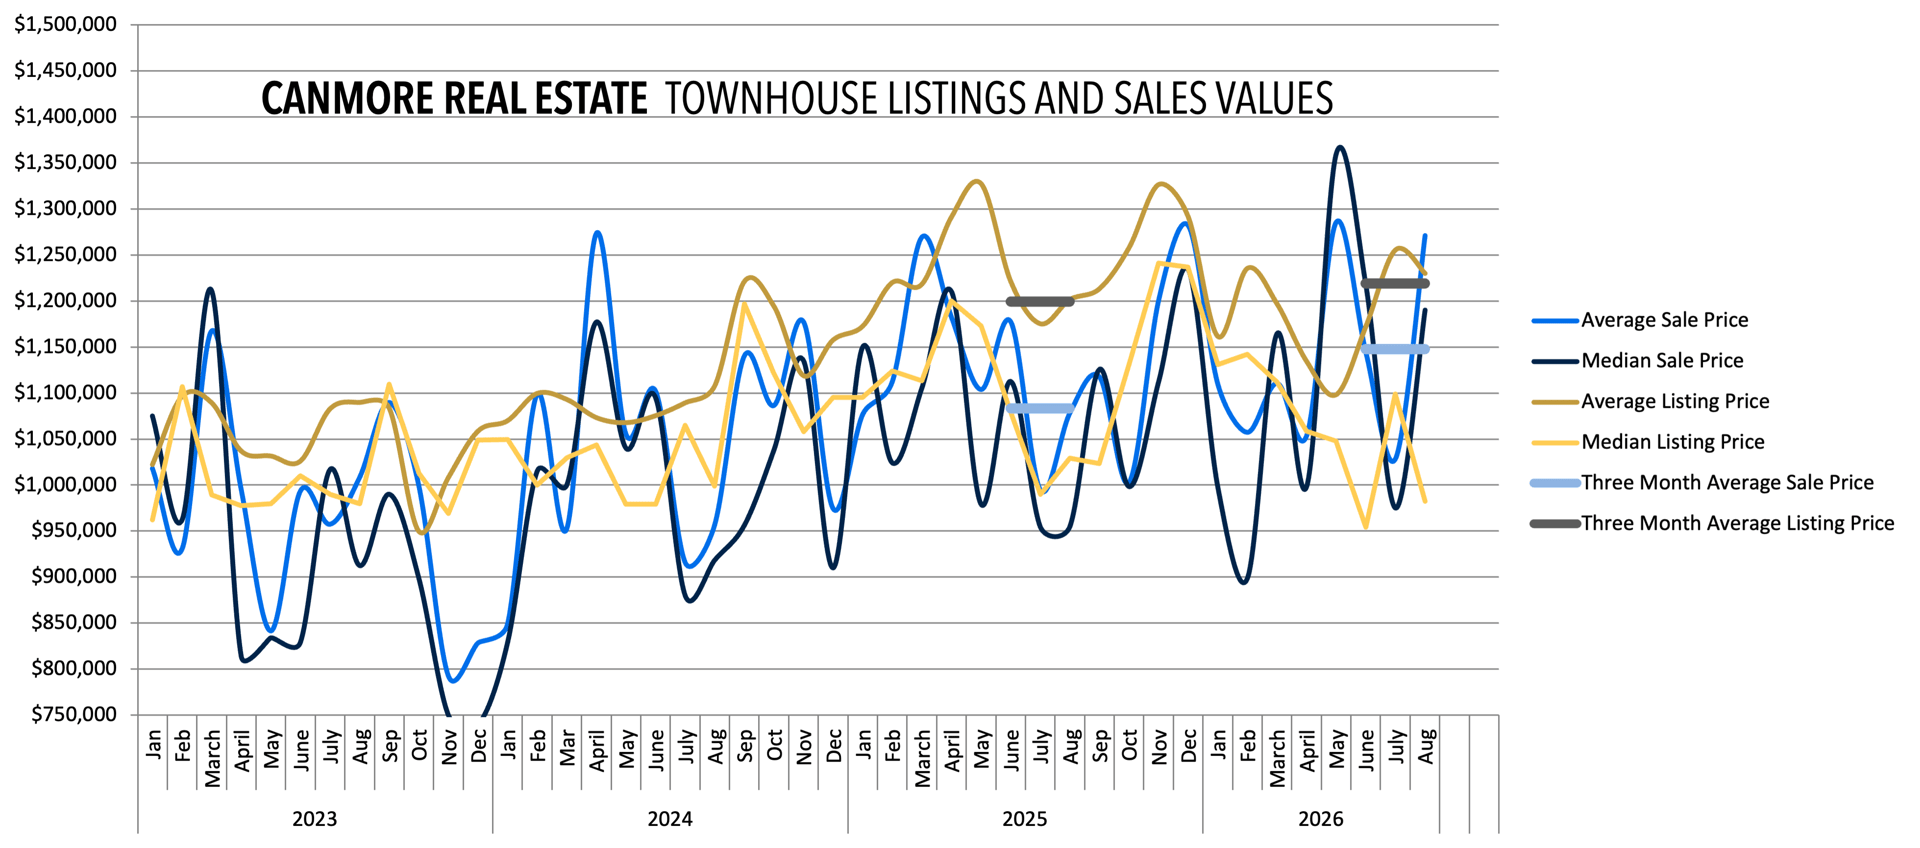
Townhomes cooled from July’s exceptional month — 11 sold in August versus July’s 17 — but that’s still up 22.2% from August 2025’s 9. What stands out is inventory: active townhome listings fell from 41 in August to just 32 by early September, down 22% in a month and down 23.8% from a year ago. While detached and condo supply are both building for fall, townhome supply is doing the opposite.
Pricing reflects that tightness. The median sale price jumped to $1,190,000 in August, up 22.1% from July’s $975,000 and up 24.6% from August 2025’s $955,000 — the strongest year-over-year price gain of any segment this month. Months-of-inventory sits at roughly 3.7, up slightly from July’s tight 2.5 but still the lowest of any residential segment and squarely in balanced-to-seller’s territory. If listings keep shrinking while pricing keeps climbing, this is the segment most likely to tip further toward sellers over the fall.
Short-Term Rentals: The Quietest Month in Over a Year
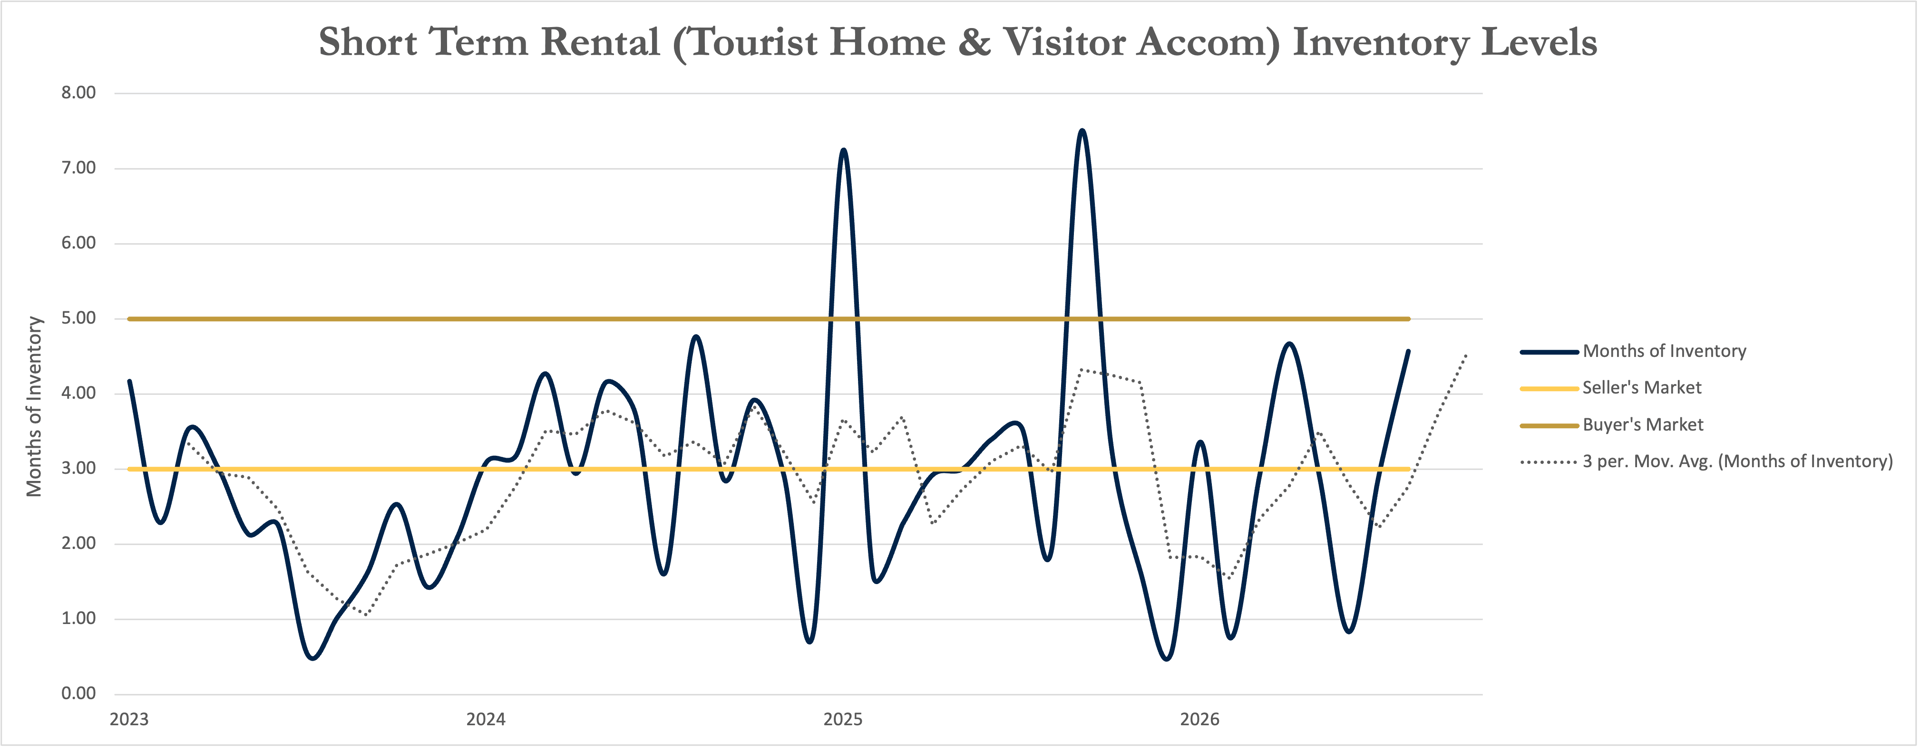
Short-term rental sales fell to 7 in August, down from July’s 10 and down 41.7% from August 2025’s 12 — the first month this year where STR sales have come in below the same month a year earlier. Nothing in the data points to a specific project or supply event behind this; it reads as organic softening rather than a one-time swing, continuing the pattern that started when June’s Dead Man’s Flats-driven spike rolled off.
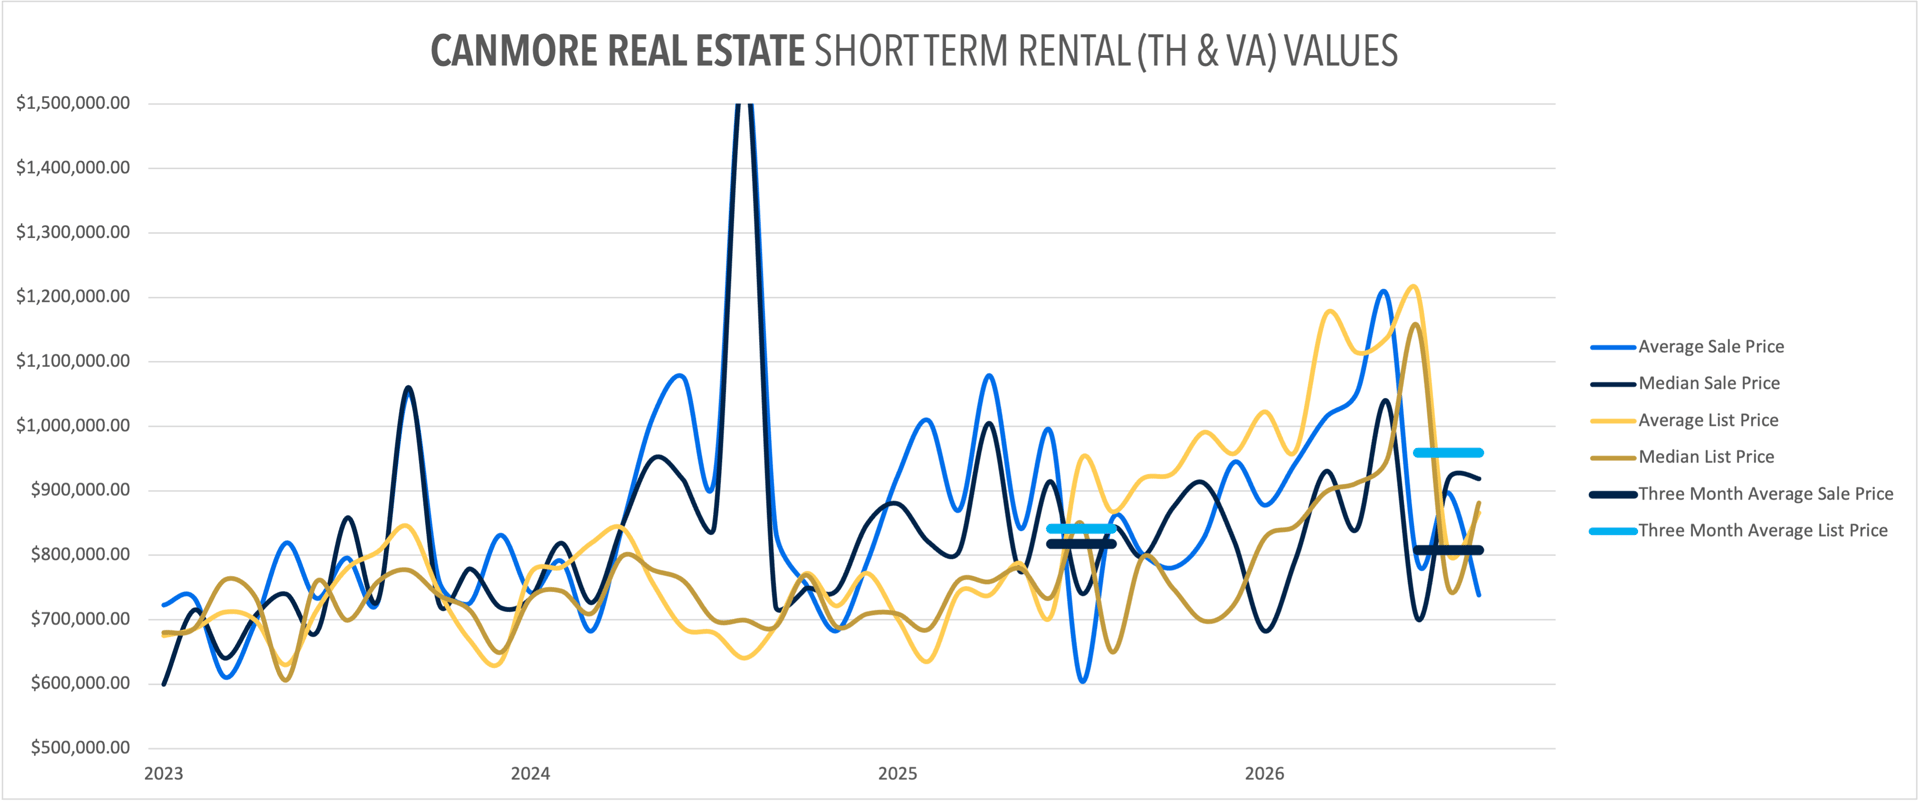
Active listings, meanwhile, ticked up from 29 in August to 32 by early September, up 39.1% from a year ago. Fewer sales against more listings pushed months-of-inventory to roughly 4.1, from July’s 3.3 — still balanced, but moving toward buyers for the first time in a while. Pricing held firm despite the volume drop: the median sale price was $918,750, essentially flat with July’s $917,962 and up 8.9% from August 2025’s $843,500 — fewer transactions, but at solid prices, consistent with lower-priced project inventory being fully absorbed and organic resale activity setting the tone now.
Lots & Land: Too Small a Sample to Read Into
No lot sales closed in August, in either 2026 or 2025 — consistent with how thin this category is on a month-to-month basis. Active lot listings sit at 13 heading into September, up slightly from 10 a year ago. As always, we’re keeping this segment out of the trend analysis; the volumes are too small for a month-over-month or year-over-year comparison to mean much.
The Bigger Picture: Residential Ahead for the Year, Short-Term Rentals Still Skewed by Two Spikes
Zooming out to year-to-date (January through August), with Lots set aside as too small a sample to be meaningful:
Residential — Year-to-Date 2026 vs. 2025: - Detached & Semi-Detached: 94 vs. 103 — down modestly - Apartment Condos: 80 vs. 72 — up - Townhomes: 100 vs. 90 — up - Residential Total: 274 vs. 265 — up 3.4%
Short-Term Rentals — Year-to-Date 2026 vs. 2025: - 150 vs. 96 — up 56.2%, still driven almost entirely by February’s (48 sales) and June’s (40 sales, 30 from the Dead Man’s Flats project) project-linked spikes rather than the organic pace we’ve seen since
Total Sales — Year-to-Date: 418 vs. 366 — up 14.2%
Residential is now genuinely ahead of last year for the first time in 2026, not just “essentially flat” — a real, if modest, improvement built mostly on July’s rebound and August holding most of those gains. Short-term rentals remain the bigger year-to-date growth story on paper, but the underlying monthly trend has flipped: July and August both came in at or below last year’s pace, which suggests the spring spikes are becoming the exception rather than the new normal.
What It Means for Buyers and Sellers
Fall is genuinely one of the best times of year to be active in the Bow Valley market — the warm days, cool nights, and changing colours aside, it’s often one of the busiest stretches for sales right after the spring market, and this year is shaping up no differently. Early August was quiet, but the back half of the month picked up and September has continued at a steady pace.
The clearest read on pricing right now: well-positioned, well-priced, and well-cared-for homes continue to transact without much trouble, while listings pushing the upper end of their range or priced aspirationally are sitting. That’s true across every segment, but it matters most in detached and apartment condos, where supply is building fastest heading into fall — accurate pricing and strong presentation carry more weight in that environment. Townhome sellers, by contrast, are working with the tightest and shrinking inventory of any residential segment and have more room to hold firm on price.
For buyers, that split cuts the other way: there’s genuinely more selection and more negotiating room in detached homes and apartment condos than there was a few months ago, while townhomes remain the most competitive corner of the market. Short-term rental buyers are also seeing a bit more room than earlier in the year, with listings up and sales at their quietest pace in over a year.
A couple of bigger-picture factors are worth keeping in mind, without over-reading either one. The Bank of Canada’s rate has stayed steady, which is helping keep financing conditions predictable. And there’s a “wait and see” mood around Canada’s foreign buyer ban, which is currently set to expire January 1, 2027 — what happens after that (an extension, changes, or an actual expiry) isn’t settled yet, and it’s the kind of policy question that can shift buyer behaviour once there’s more clarity. Broader macro and political uncertainty globally is also filtering through to local sentiment, even if it’s not showing up as a dramatic shift in the numbers yet.
August 2026 Market Snapshot
• Active Listings (All Types, early September): 194
• Total Sales (August): 38
• Detached & Semi-Detached Inventory: ~5.3 Months (Balanced, Loosening)
• Apartment Condominium Inventory: ~5.3 Months (Balanced)
• Townhouse Inventory: ~3.7 Months (Balanced, Tightest Segment)
• Short-Term Rental Inventory: ~4.1 Months (Balanced, Loosening)
• August 2026 Residential Sales vs. August 2025: 31 vs. 23 (Up ~35%)
• August 2026 Short-Term Rental Sales vs. August 2025: 7 vs. 12 (Down ~42%)
• YTD 2026 Residential Sales vs. YTD 2025: 274 vs. 265 (Up ~3%)
• YTD 2026 Short-Term Rental Sales vs. YTD 2025: 150 vs. 96 (Up ~56%)
• Overall Market Condition: Balanced, With a Genuine Divergence Between Tightening Townhomes and Building Detached/Condo Supply
If you’re considering buying or selling real estate in Canmore, Banff, Harvie Heights, Dead Man’s Flats, Exshaw, or Lac des Arcs, this is exactly the kind of month where knowing which segment your property or search falls into makes all the difference. Working with a local Canmore Realtor who tracks these trends month to month — and knows which numbers are signal versus noise — can help you time your move and price it right heading into one of the valley’s busiest selling seasons.