A Real Residential Rebound — Just Not Everywhere at Once
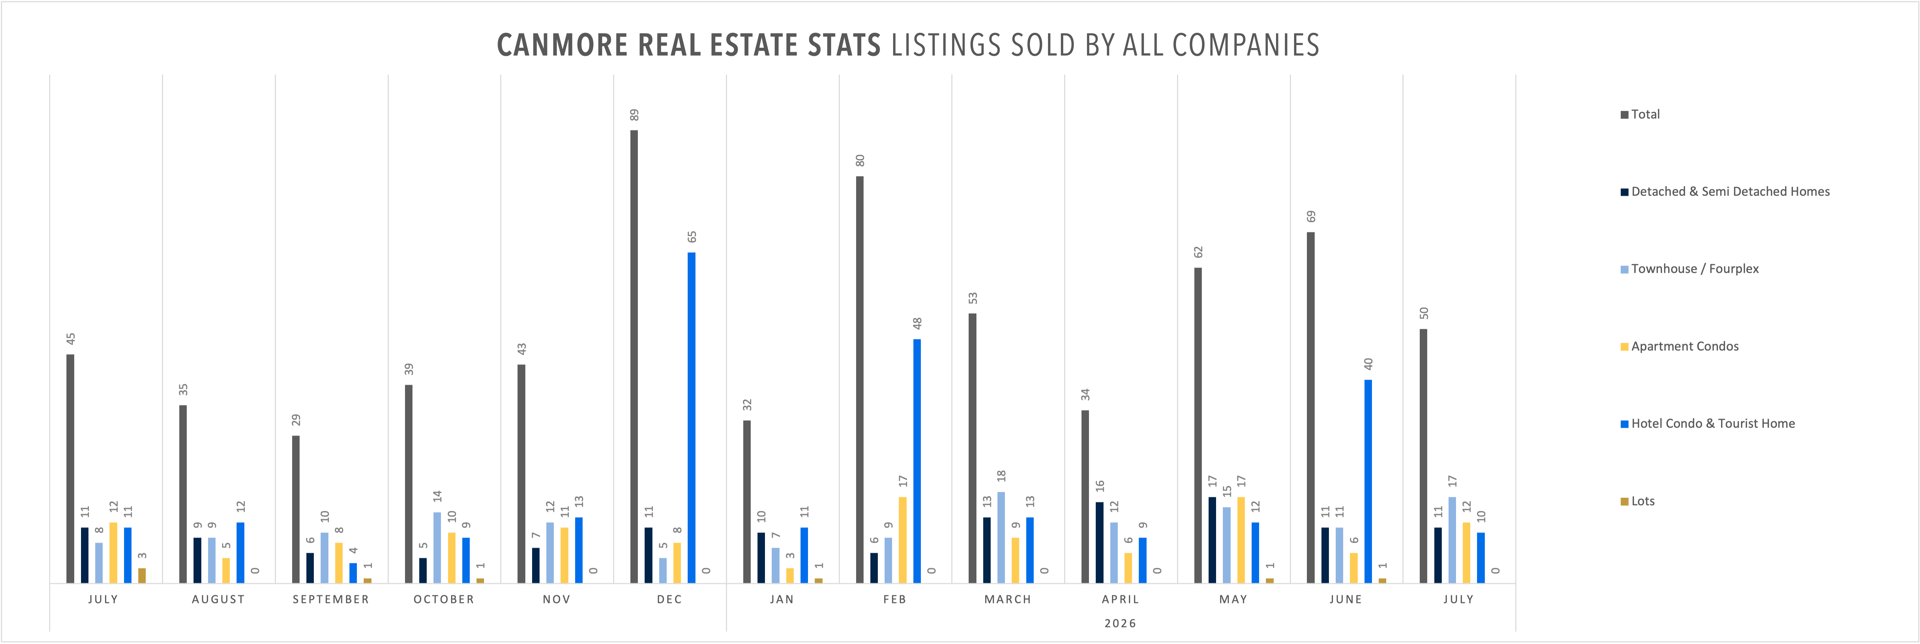
July posted 50 sales — on paper, a step down from June's 69. But that headline comparison is misleading in the opposite direction from last month's: June's number was inflated by a one-time short-term rental project release, and once that rolled off, what's left in July is the strongest residential month-over-month improvement we've seen in some time. Detached, townhome, and apartment condo sales combined jumped 43% from June to July, and are up 29% compared to July of last year.
That's a genuine signal, but it's not evenly spread. Dig into the segments and the gain is concentrated almost entirely in townhomes, while detached and apartment condo sales came in exactly flat year over year. This is still a market that rewards reading the segment detail, not just the headline number — it's just that this month, for the first time in 2026, residential demand is the one carrying the story instead of short-term rentals.
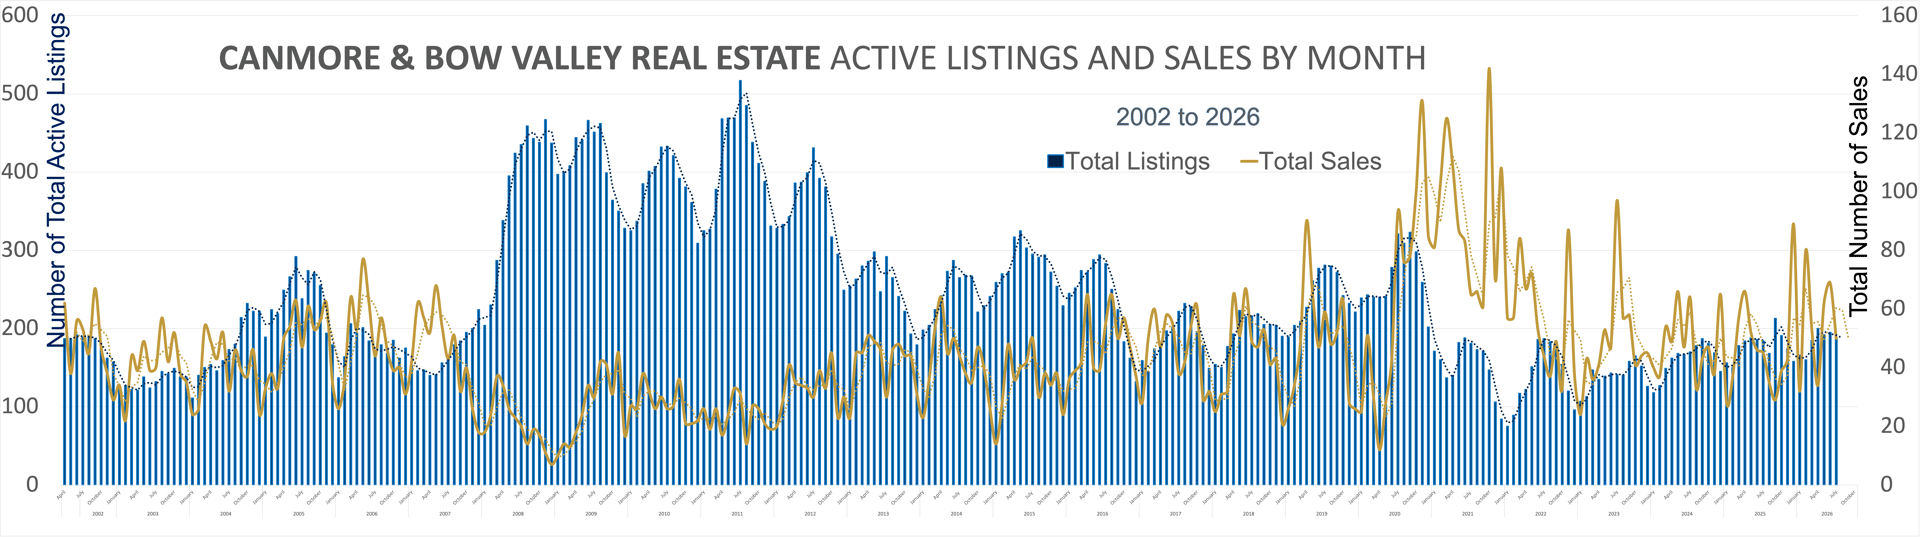
Sales Activity: June's Spike Fades, Residential Picks Up the Slack
July's 50 sales look lower than June's 69 at first glance, but June's total leaned heavily on the new Dead Man's Flats short-term rental release, which alone accounted for 30 of that month's sales. Strip the STR swing out of both months and the real story flips: residential sales (detached, townhome, and apartment condo combined) rose from 28 in June to 40 in July — a 43% month-over-month increase — while short-term rental sales normalized from June's spike-driven 40 back down to 10, close to the segment's typical monthly pace.
Compared to July 2025, residential sales are up 29% (40 vs. 31), while short-term rental sales are essentially flat, down slightly (10 vs. 11). Total sales for the month are up 11% year over year (50 vs. 45) — and unlike earlier in 2026, this time residential growth is doing the heavy lifting, not a new-construction release.
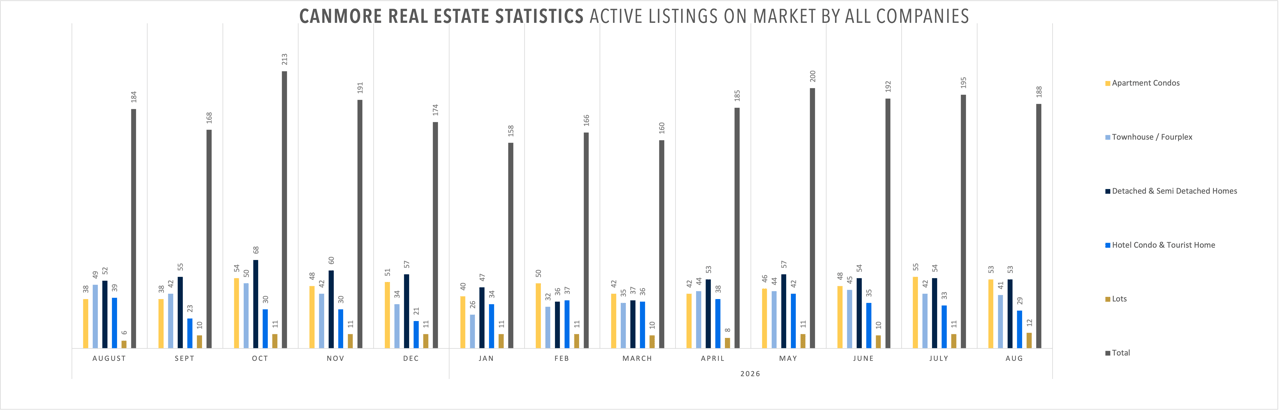
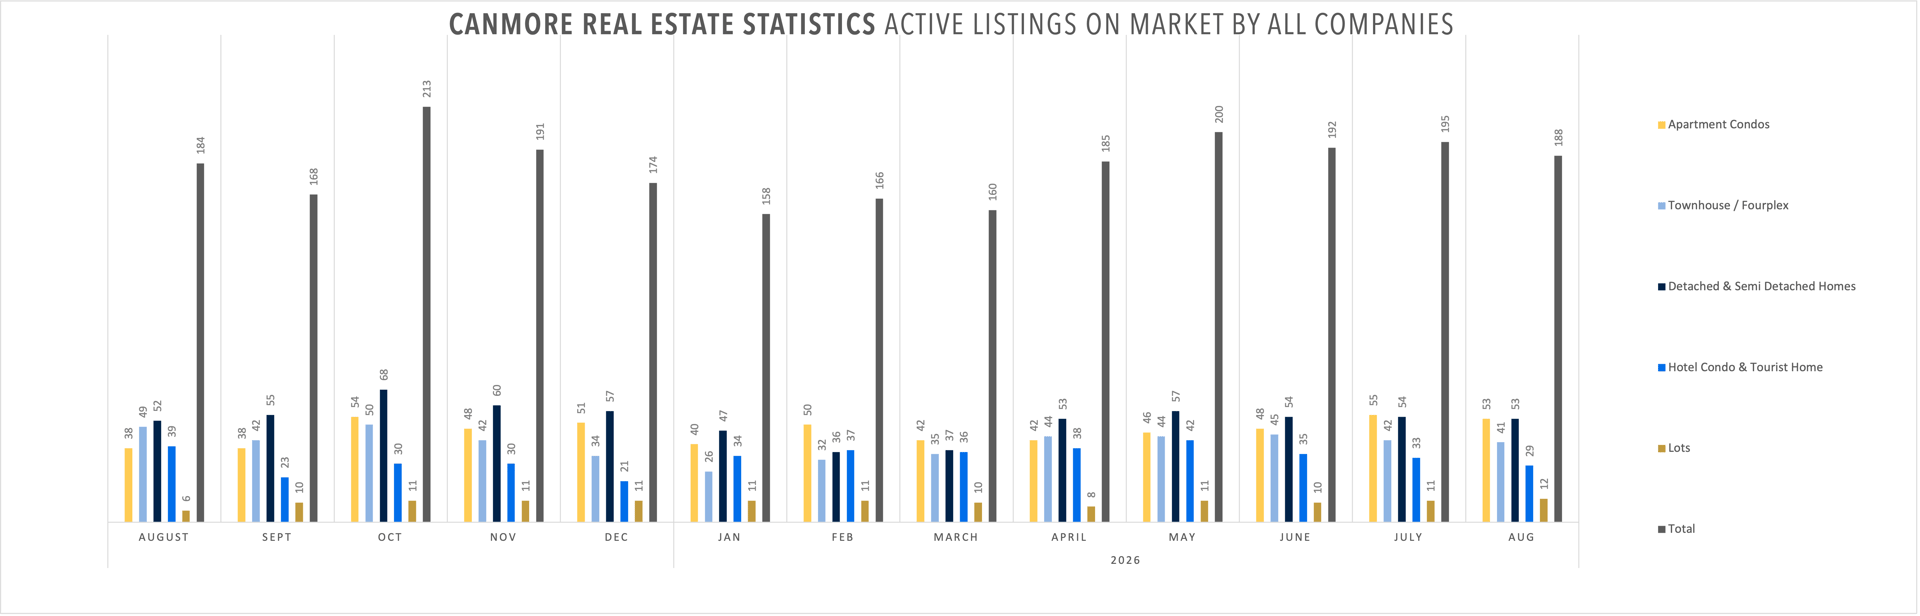
Active listings sat at 195 in July, then eased to 188 as of early August — down about 3.6%, a modest pullback rather than a meaningful shift in supply.
Detached & Semi-Detached Homes: Flat and Steady
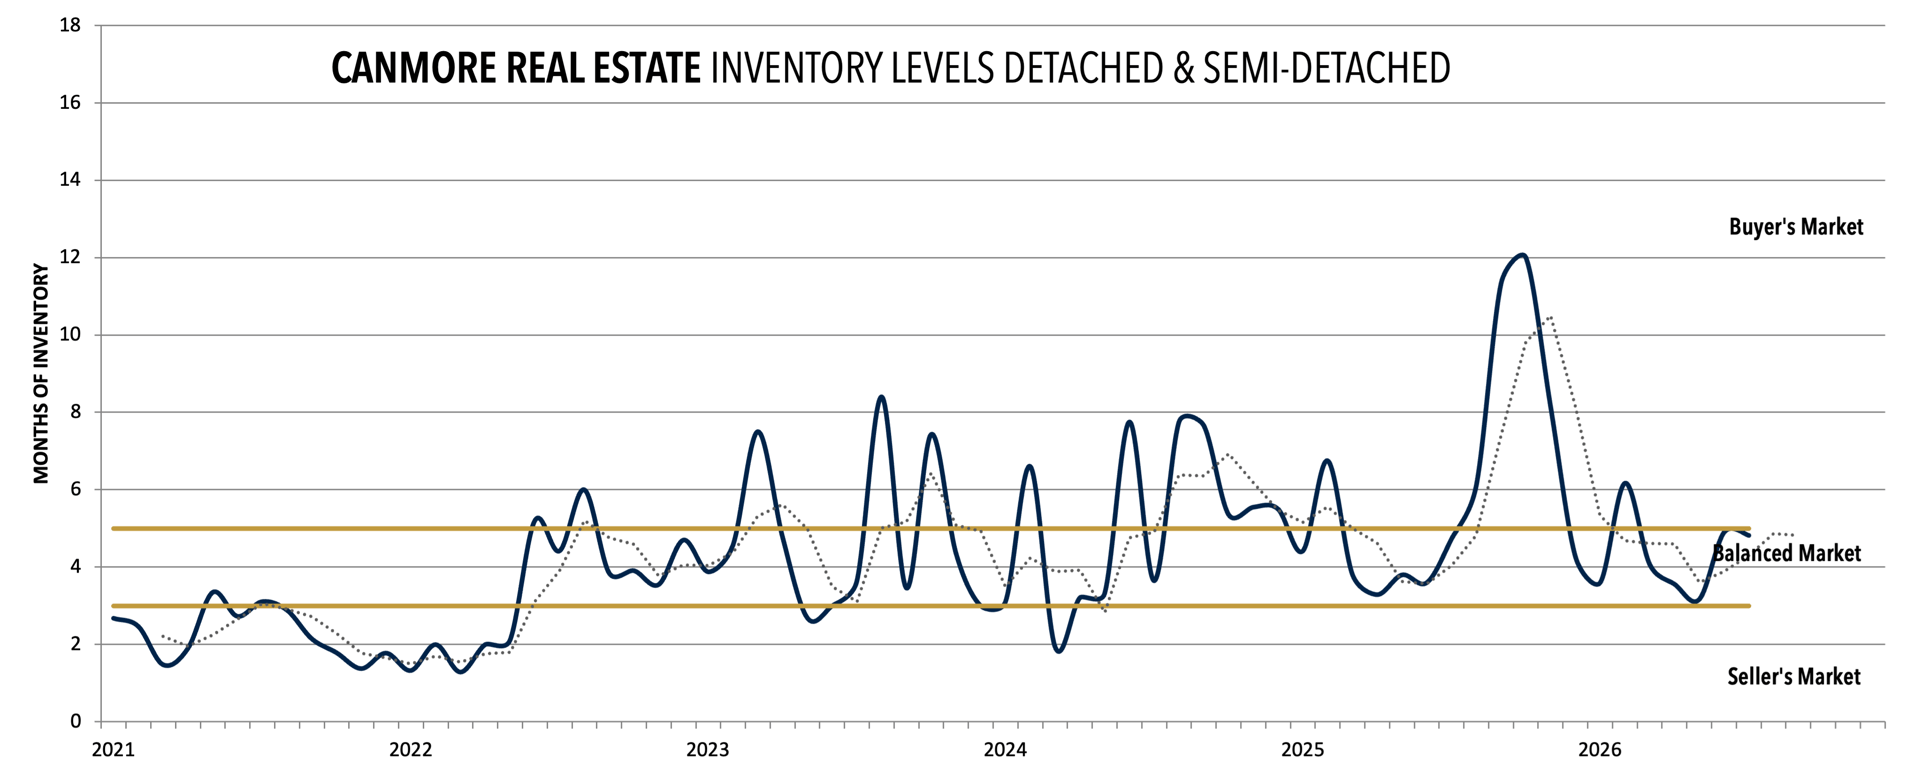
Eleven detached and semi-detached homes sold in July — identical to July 2025's count, and unchanged from June. Inventory held at 54 active listings, putting months-of-inventory at roughly 4.9, right where it sat in June and squarely in balanced territory.
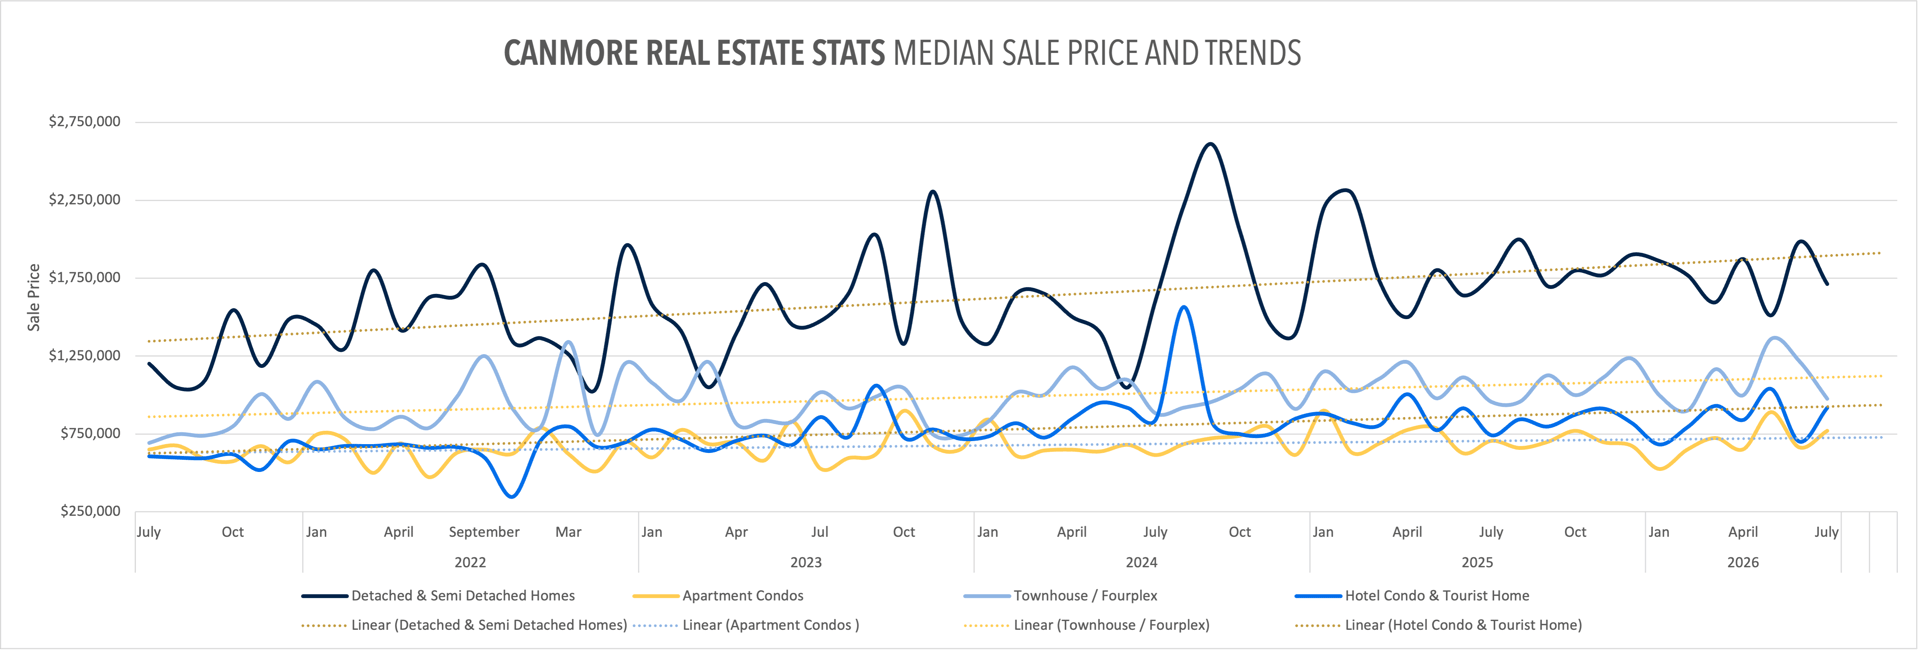
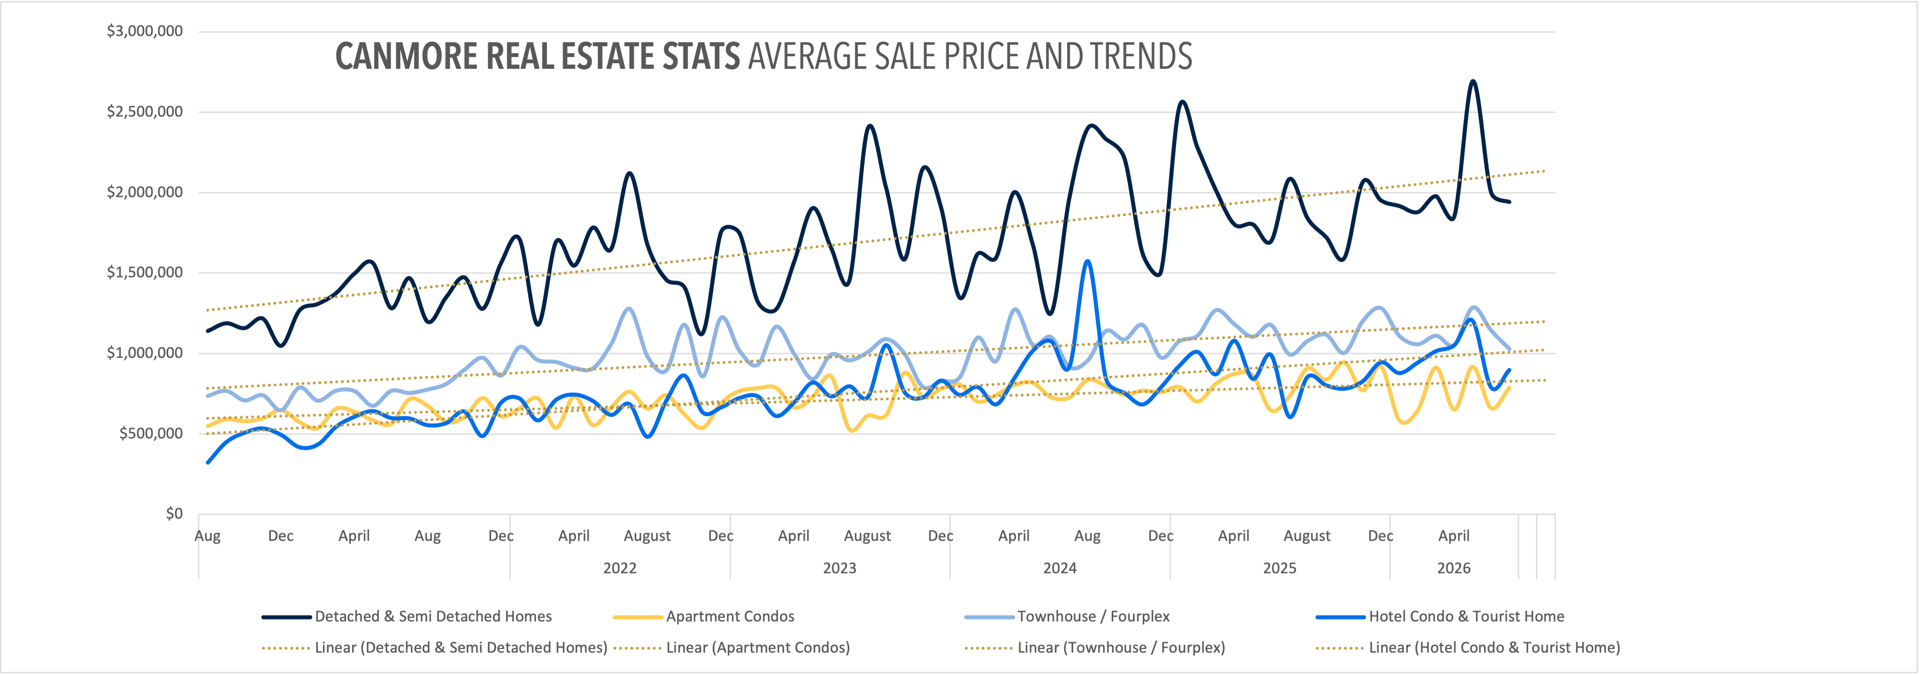
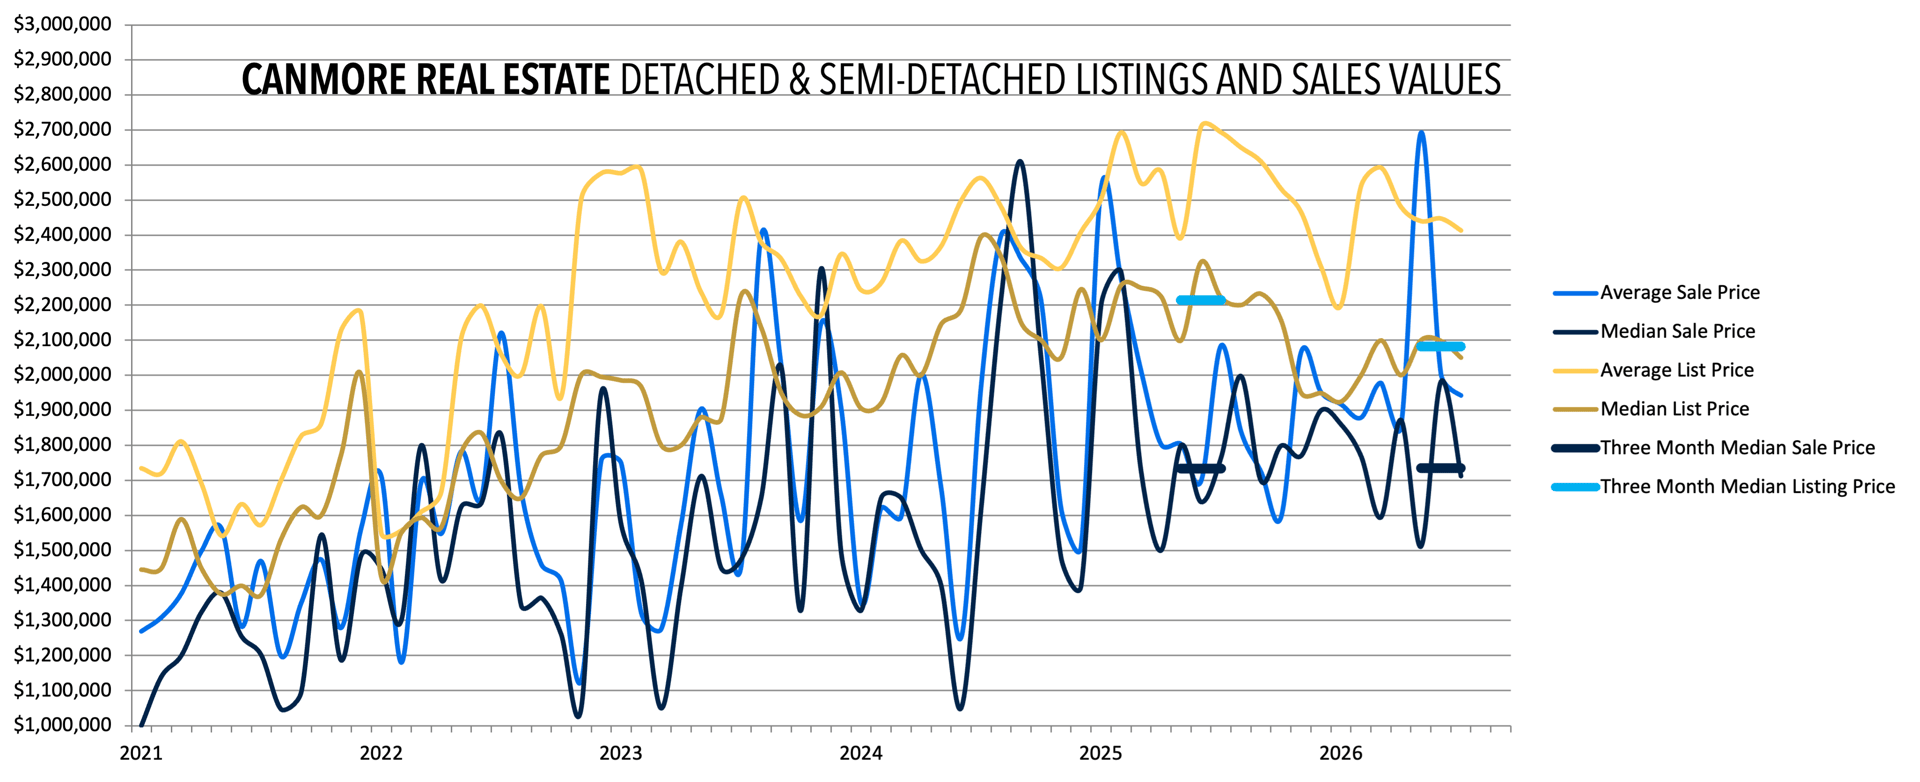
Pricing moved lower on both a monthly and yearly basis: the median sale price came in at $1,712,500, down from $1,982,610 in June and modestly below July 2025's $1,765,000. At this segment's volume — around a dozen transactions a month — swings like this are typical and shouldn't be read as a change in direction; May's median, for comparison, sat at $1.5 million and June's near $2 million, all within a few months of each other.
Apartment Condos: Inventory Tightens as Sales Hold Steady
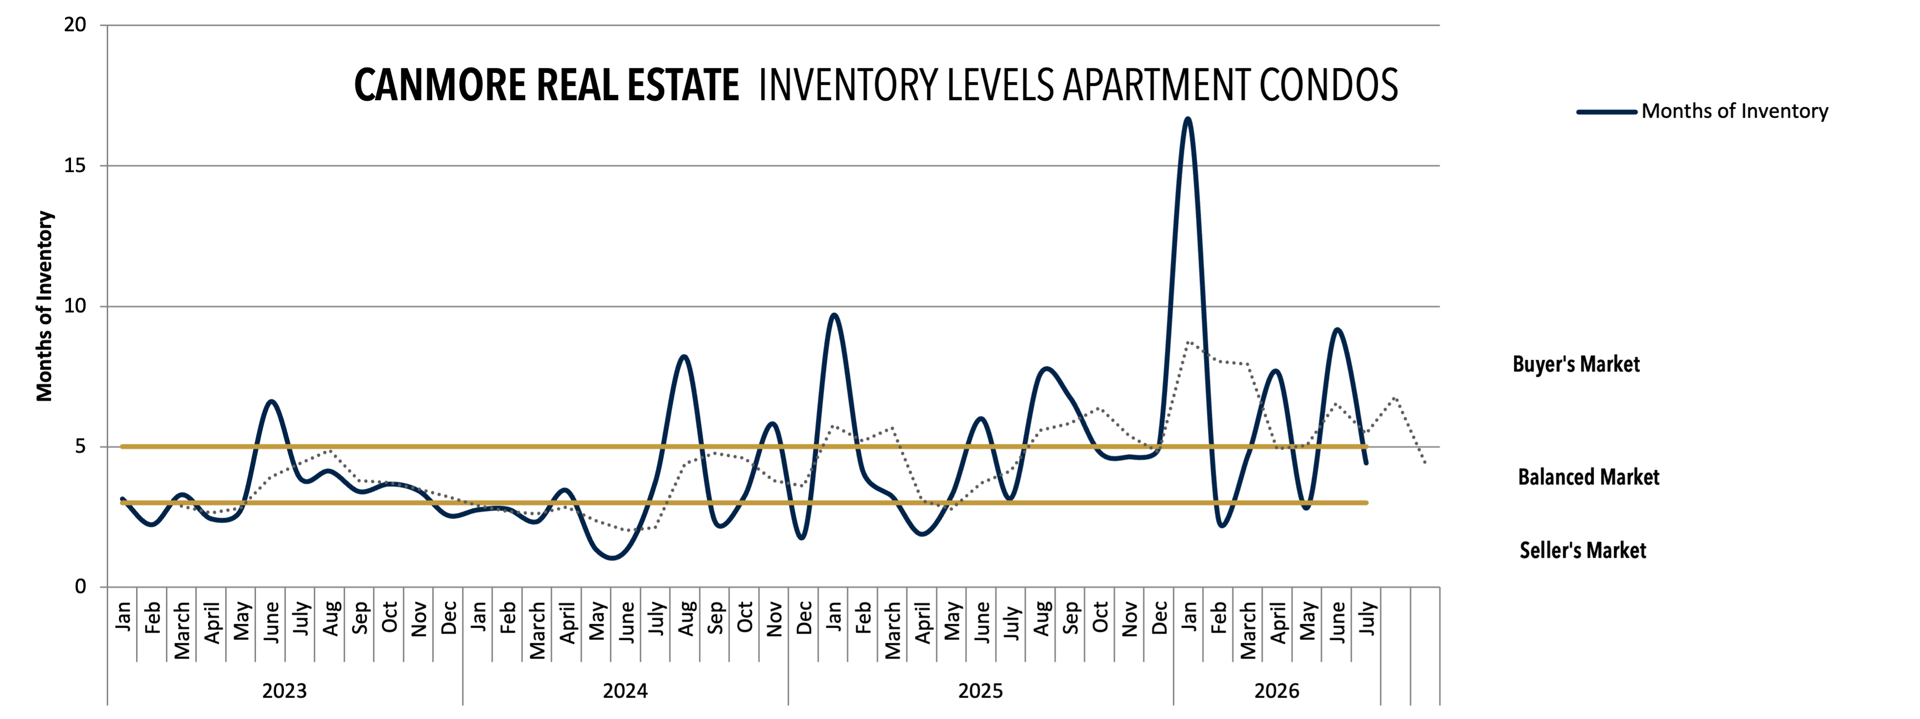
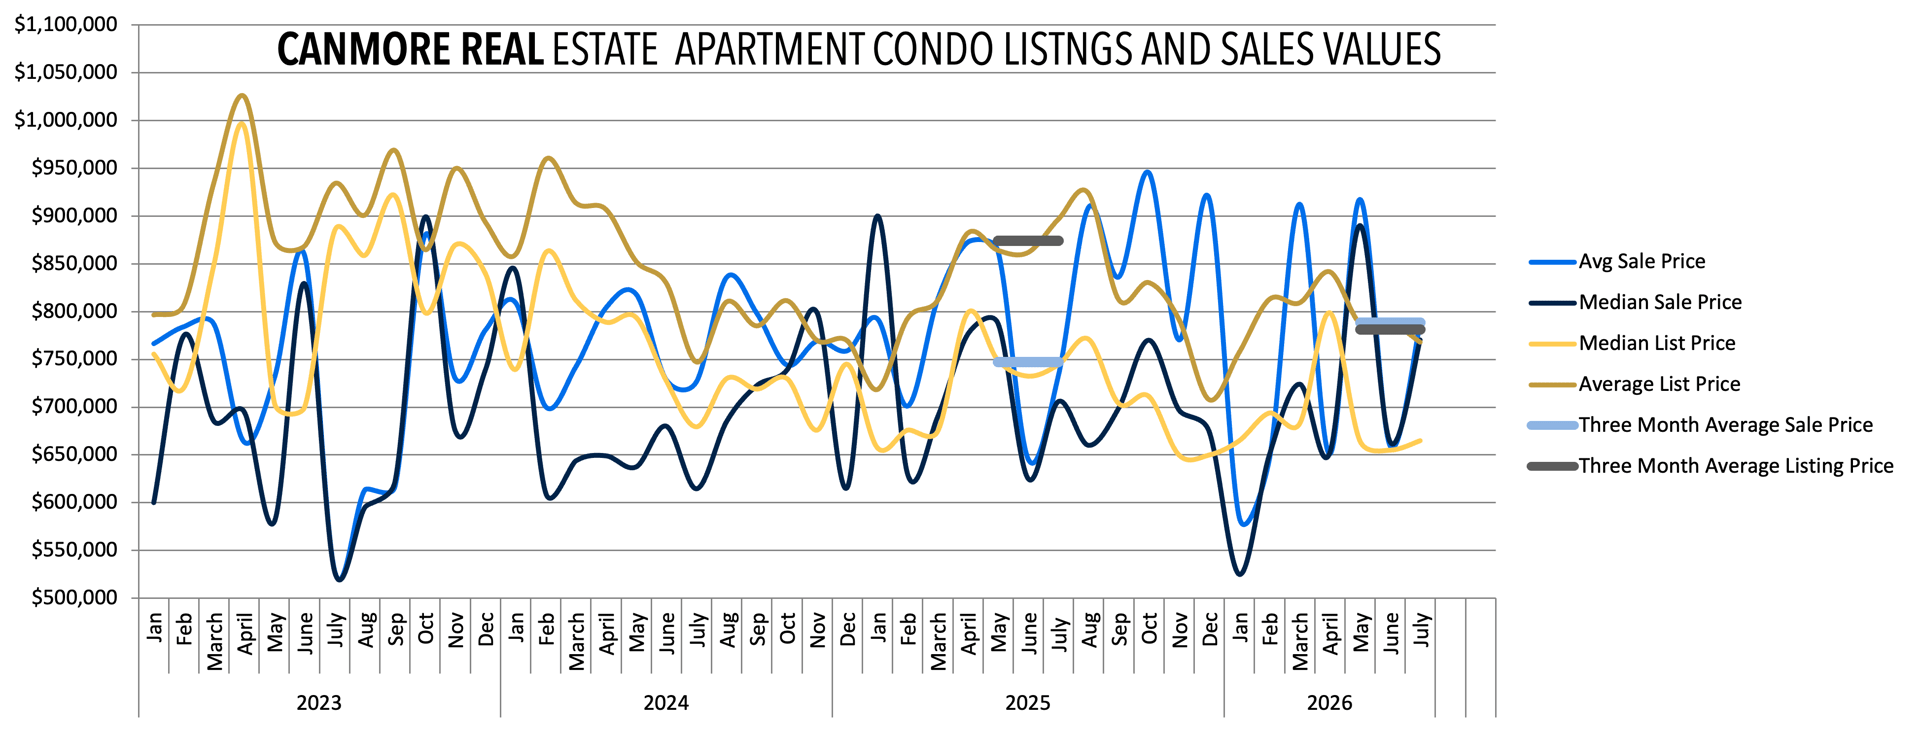
Apartment condos sold 12 units in July, double June's 6 and identical to July 2025's count. Active listings ticked down slightly to 55, bringing months-of-inventory to roughly 4.6 — a meaningful tightening from June's 8.0 months, and back into balanced-market territory after several months on the buyer's-market side of the line.
Pricing moved up alongside that tightening: the median sale price rose to $770,250, up about 16% from June's $663,700 and up roughly 9% from July 2025's $705,800. Year over year, sales volume in this segment is flat — the story here is less about more buyers showing up and more about inventory being absorbed at a steadier pace after May's Altitude at Three Sisters-driven spike worked its way through the numbers.
Townhomes: The Segment Doing the Heavy Lifting
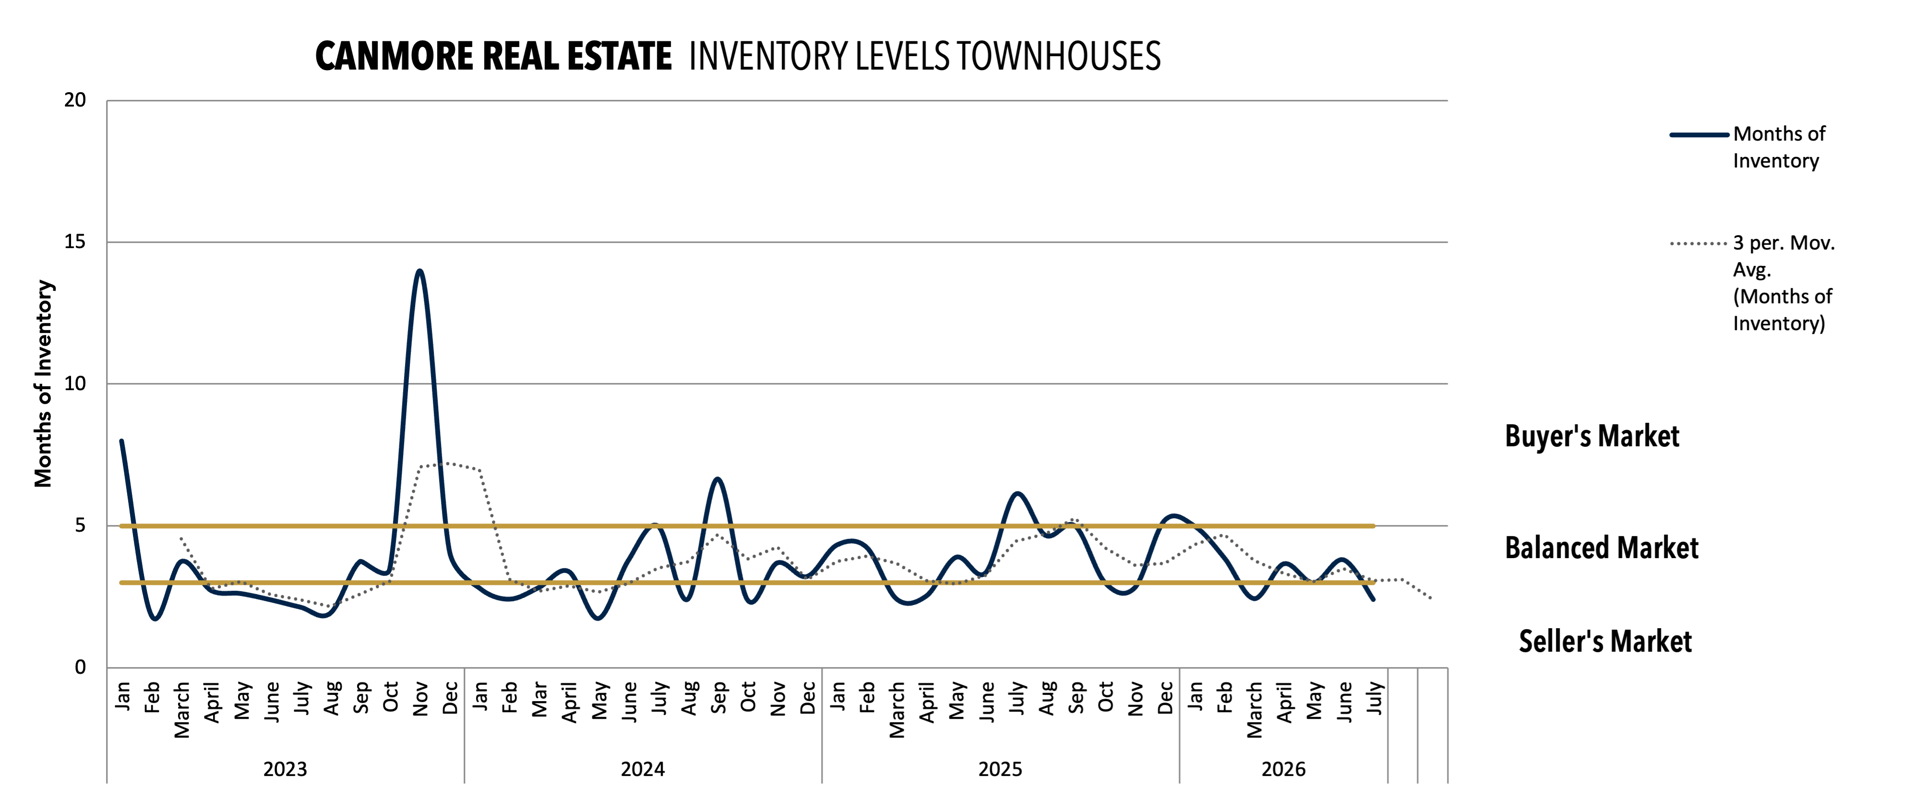
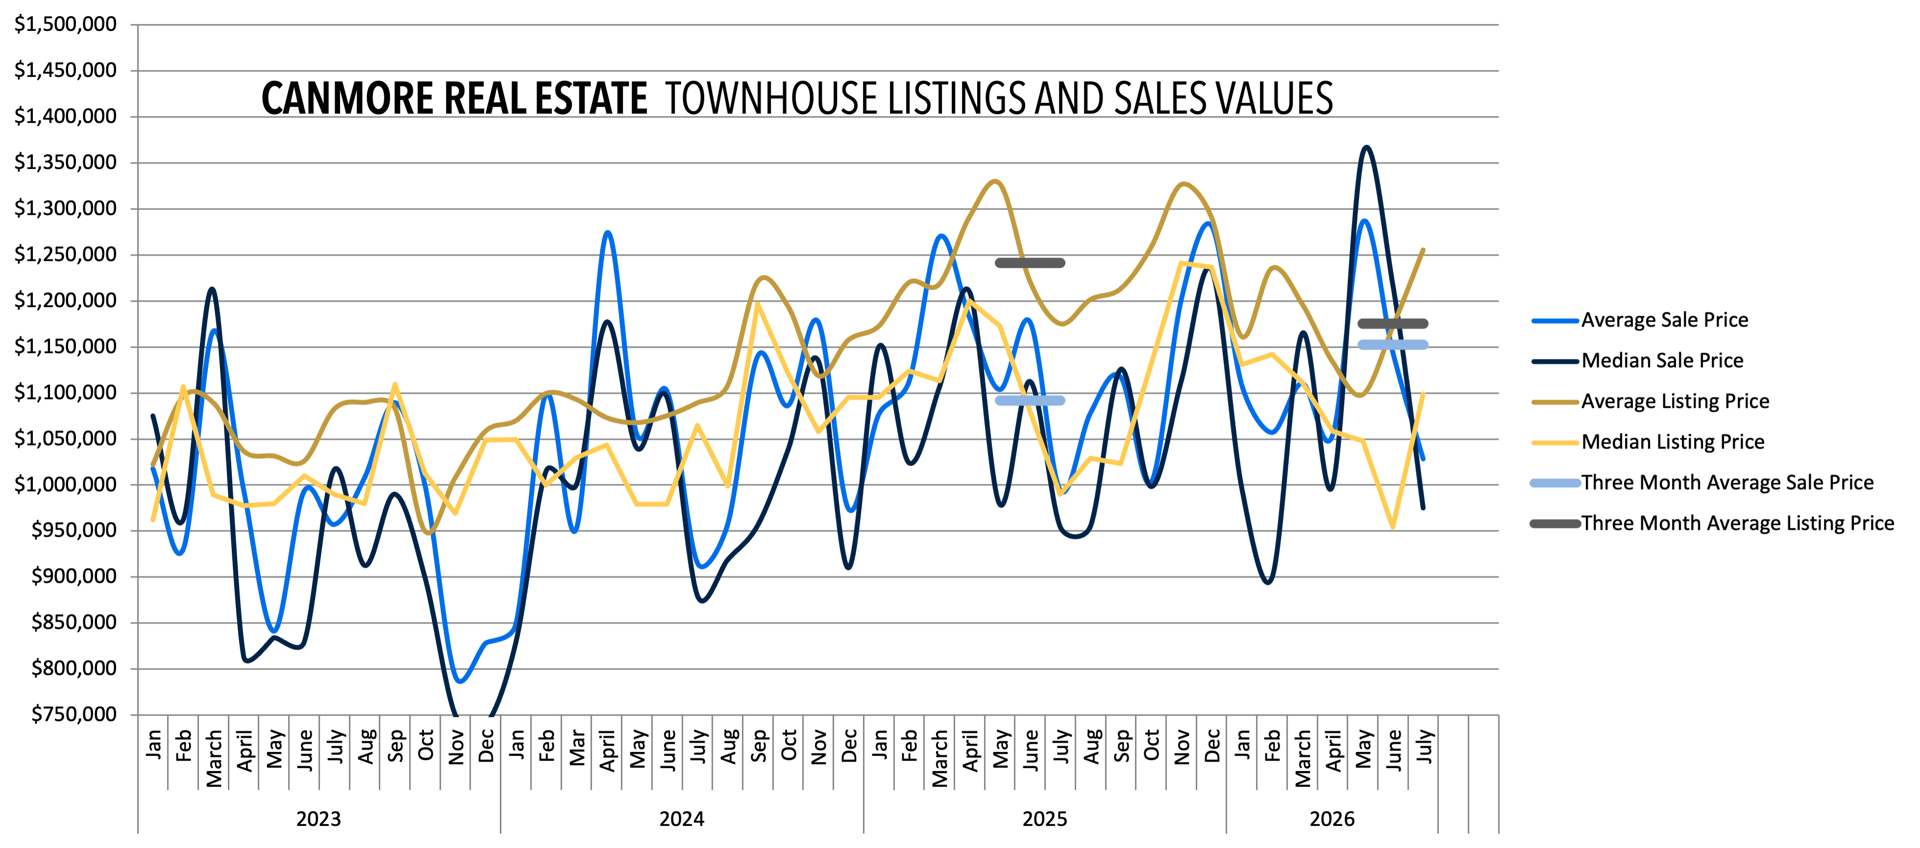
Townhomes are where July's residential strength really shows up. Seventeen townhomes sold in July, up 55% from June's 11 and more than double July 2025's 8 — the largest year-over-year gain of any segment this month. Active listings held essentially steady at 42 (down only slightly from June's 45), which pushed months-of-inventory down to roughly 2.5 — the tightest reading of any residential segment right now, and into seller's-market territory.
Pricing cooled from the spring peak but remains firm: the median sale price was $975,000 in July, down from June's $1,217,000 and May's $1.36 million high, but still up modestly from July 2025's $954,500. Unlike the STR segment's project-driven spikes earlier this year, there's no obvious sign of a single new-listing release behind this — active inventory didn't spike and then collapse the way it does around a new-construction launch — which suggests this is organic buyer demand rather than a one-project effect. Worth watching next month to see if it holds.
Short-Term Rentals: Back to a Normal Pace
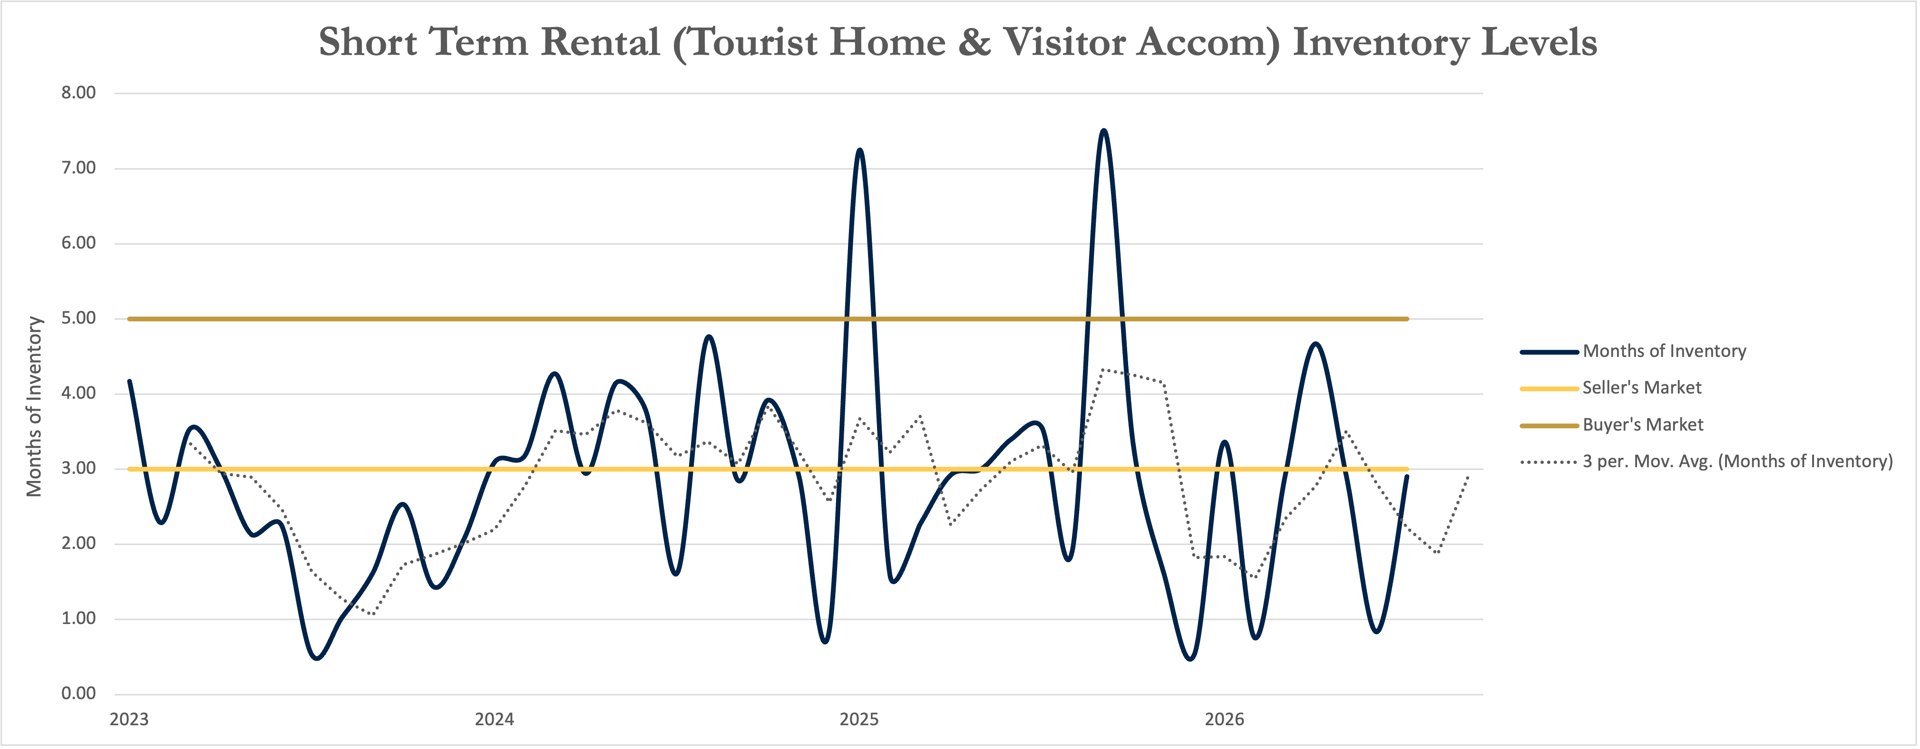
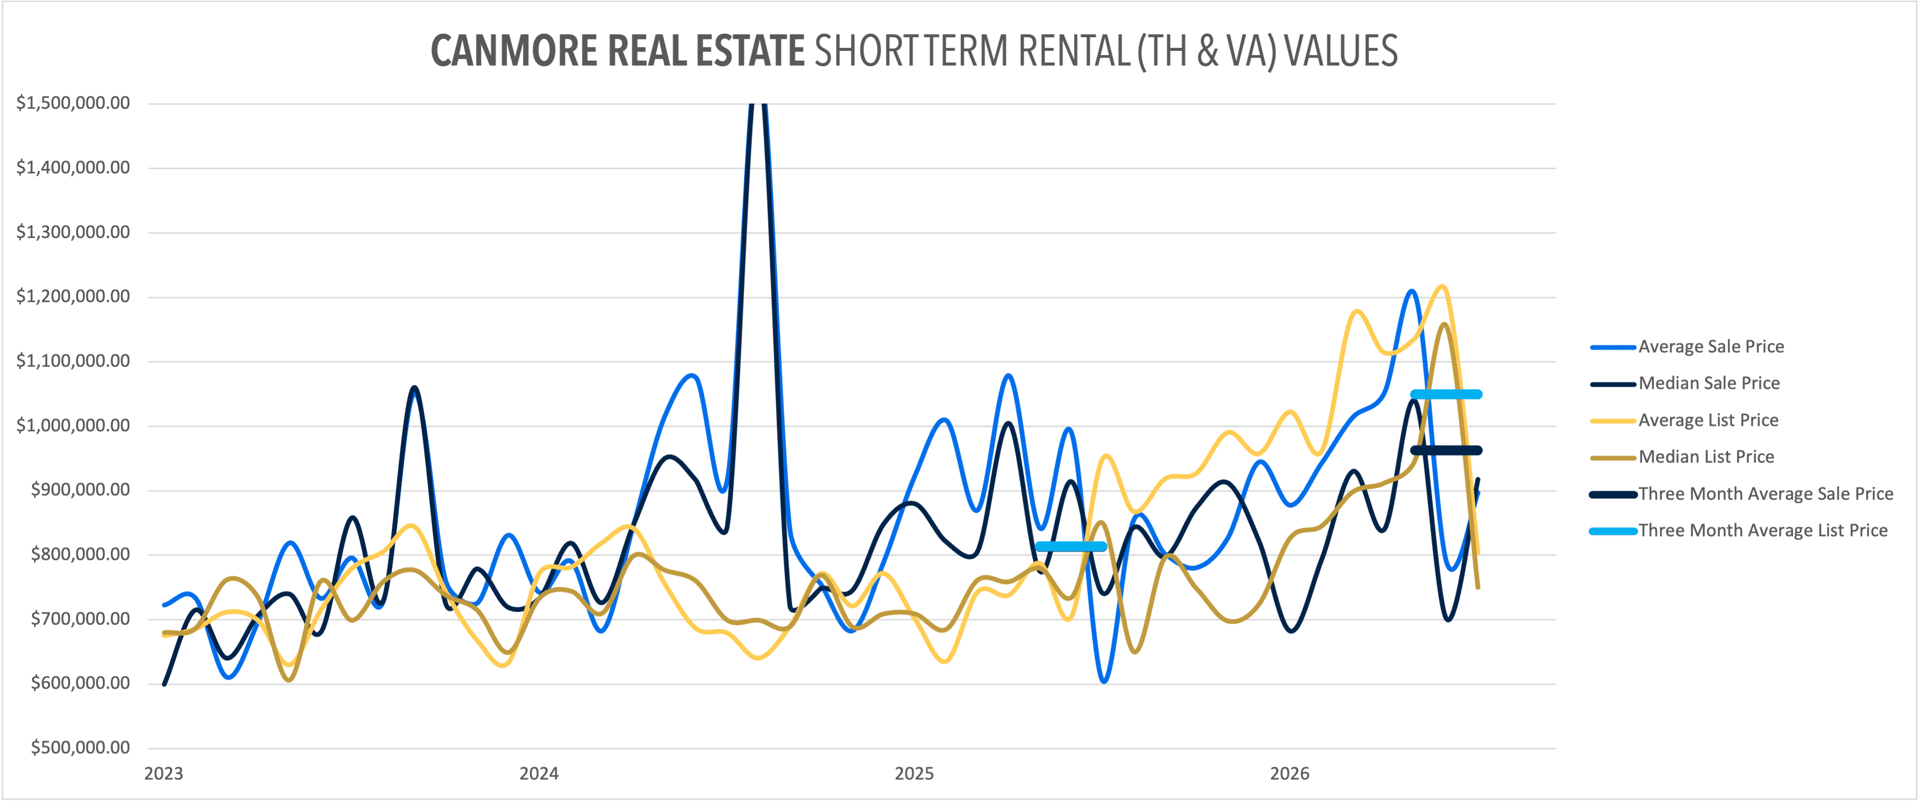
After June's Dead Man's Flats-driven spike (40 sales, 30 tied to that single project), short-term rental sales returned to a more typical 10 units in July — essentially in line with July 2025's 11. Active listings continued to shrink, down to 33 in July and 29 by early August, a 26% year-over-year decline, as that new supply gets absorbed and no comparable release has followed it.
Pricing swung back up now that the lower-priced project units are out of the sales mix: the median sale price jumped to $917,962, up 31% from June's $701,222 and up 24% from July 2025's $741,300. Months-of-inventory moved from June's artificially tight 0.9 back up to a more balanced 3.3 — a reversion toward normal, not a new trend, now that the one-time supply event has passed through the market.
The Bigger Picture: Residential Catches Up, Short-Term Rentals Still Lead the Year
Zooming out to year-to-date (January through July), the same Residential-versus-Short-Term-Rental split we've tracked all year tells a more balanced story than any single month suggests, with Lots set aside as too small a sample to be meaningful.
Residential — Year-to-Date 2026 vs. 2025:
- Detached & Semi-Detached: 84 vs. 94 — down modestly
- Apartment Condos: 70 vs. 67 — up slightly
- Townhomes: 89 vs. 81 — up modestly
- Residential Total: 243 vs. 242 — essentially flat, up 0.4%
Short-Term Rentals — Year-to-Date 2026 vs. 2025:
- 143 vs. 84 — up roughly 70%, driven almost entirely by two project-linked spikes: February (48 sales) and June (40 sales, 30 from Dead Man's Flats)
Total Sales — Year-to-Date: 380 vs. 331 — up roughly 15%
The year-to-date Residential number landed at essentially dead even with last year — a bumpier ride to get there than that flat figure implies, with a soft Q2 largely offset by a strong February and now July's rebound. Short-term rentals remain the segment doing most of the work on 2026's overall sales growth, but July was the first month this year where residential demand, not a new STR release, was the more interesting story.
What It Means for Buyers and Sellers
For buyers, townhomes are the segment to move quickly on — inventory is the tightest of any residential category right now, and that combination of strong sales and thinning supply typically doesn't last. Apartment condo buyers still have room to negotiate, though less than they did in June. Short-term rental buyers are working with a shrinking, quieter pool now that the summer's big release has been absorbed.
For sellers, July is an encouraging month after a quiet Q2 — residential demand picked up meaningfully, particularly for townhomes, and pricing has held or improved in every segment except detached. It's one month of data, not a confirmed trend reversal, so accurate pricing and strong presentation still matter — but it's the first genuinely positive residential signal in a while that isn't tied to a new-construction release.
July 2026 Market Snapshot
- Active Listings (All Types, early August): 188
- Total Sales (July): 50
- Detached & Semi-Detached Inventory: ~4.9 Months (Balanced)
- Apartment Condominium Inventory: ~4.6 Months (Balanced, Tightening)
- Townhouse Inventory: ~2.5 Months (Seller's Market)
- Short-Term Rental Inventory: ~3.3 Months (Balanced, Reverting to Normal)
- July 2026 Residential Sales vs. July 2025: 40 vs. 31 (Up ~29%)
- July 2026 Short-Term Rental Sales vs. July 2025: 10 vs. 11 (Down Slightly)
- YTD 2026 Residential Sales vs. YTD 2025: 243 vs. 242 (Essentially Flat)
- YTD 2026 Short-Term Rental Sales vs. YTD 2025: 143 vs. 84 (Up ~70%)
- Overall Market Condition: Balanced, Trending Toward Sellers in Townhomes — Residential Demand Improving
If you are considering buying or selling real estate in Canmore, Banff, Harvie Heights, Dead Man's Flats, Exshaw, or Lac des Arcs, understanding which of these currents applies to your specific property is critical this month. Working with a local Canmore Realtor who tracks these trends month to month — and knows which numbers are signal versus noise — can help you time your move and price it to sell.