2023 Market Review & 2024 Outlook | Canmore Real Estate


Despite various headwinds, the 2023 Canmore real estate market was relatively resilient this past year. While sales volumes are down from the heights of 2021, the total dollar value of MLS sales was $616,324,000 – the third-highest year on record. This past year, we transitioned to a more “normal” market with properties staying on the market for more than a few days, price corrections, and opportunities for buyers. The ratio of sales to listings returned to 70% this past year, after peaking at 96% in 2021; even with the shift, the market was still in a seller’s market. There were 605 total units sold, the fourth-highest year on record. The continued resilience in the market highlights Canmore and the Bow Valley’s enduring appeal as a place to visit and call home, our limited land base and supply coupled with demand continue to see growth in values over the long term.
Market Dynamics and Trends:
We have observed a consistent long-term growth in property values across all segments. Detached and semi-detached homes showed significant appreciation, indicating strong demand in this segment; the average price for detached homes has increased by 473% over 20 years. Short-term rental use properties continued to see strong growth with their flexibility of use and potential for strong returns.
While residential sales by total units decreased year over year by 17.5% the dollar sum of sales decreased only 9.6% to $405,090,000 as a result of continued rising values in the market.
Detached & Semi-Detached Homes 2023
Properties Sold 123 | 12.1% decrease year / year
Properties Listed 187 | 10.1% decrease year / year
Average Sale Price $1,753,364 |9.1% increase year / year
Median Sale Price $1,500,000 | 3.6% increase year / year
Total $ Volume Sold $215,663,759 | 3.4% decrease year / year
Residential Townhouse Condominiums 2023
Properties Sold 112 | 17% decrease year / year
Properties Listed 179 | 1.1% increase year / year
Average Sale Price $986,672 | 2.5% decrease year / year
Median Sale Price $935,000 | 3.1% decrease year / year
Total $ Volume Sold $109,076726 | 19.3% decrease year / year
Residential Apartment Condominiums 2023
Properties Sold 97 | 24.2% decrease year / year
Properties Listed 144 | 11.1% decrease year / year
Average Sale Price $732,179 | 11.7% increase year / year
Median Sale Price $640,000 | 3.3% increase year / year
Total $ Volume Sold $71,021,377 | 14.7% decrease year / year
Development Lots 2023
Properties Sold 7 | 12.5% decrease year / year
Properties Listed 14 | 12.5% decrease year / year
Average Sale Price $1,511,458 | 60.1% increase year / year
Median Sale Price $1,640,000 | 88.5% increase year / year
Total $ Volume Sold $9,328,50 | 41.8% increase year / year
Short Term Rental Use – Tourist Homes and Visitor Accommodation 2023
Properties Sold 266 | 9.8% decrease year / year
Properties Listed 336 | 9.9% decrease year / year
Average Sale Price $784,112 | 18.7% increase year / year
Median Sale Price $740,198 |11% increase year / year
Total $ Volume Sold $211,233,760 |7.4% increase year / year
Overall, inventory levels were one of the challenges this past year with listings dropping in most segments of the market. The low levels of inventory created a bottleneck within some segments of the market with potential buyers not bringing their homes to market as there were no suitable properties for them to purchase. Annual residential listings continued to decline to their lowest levels in decades; listings are 39% below their 2010 peak even with the hundreds of units that have been built over the past decade.
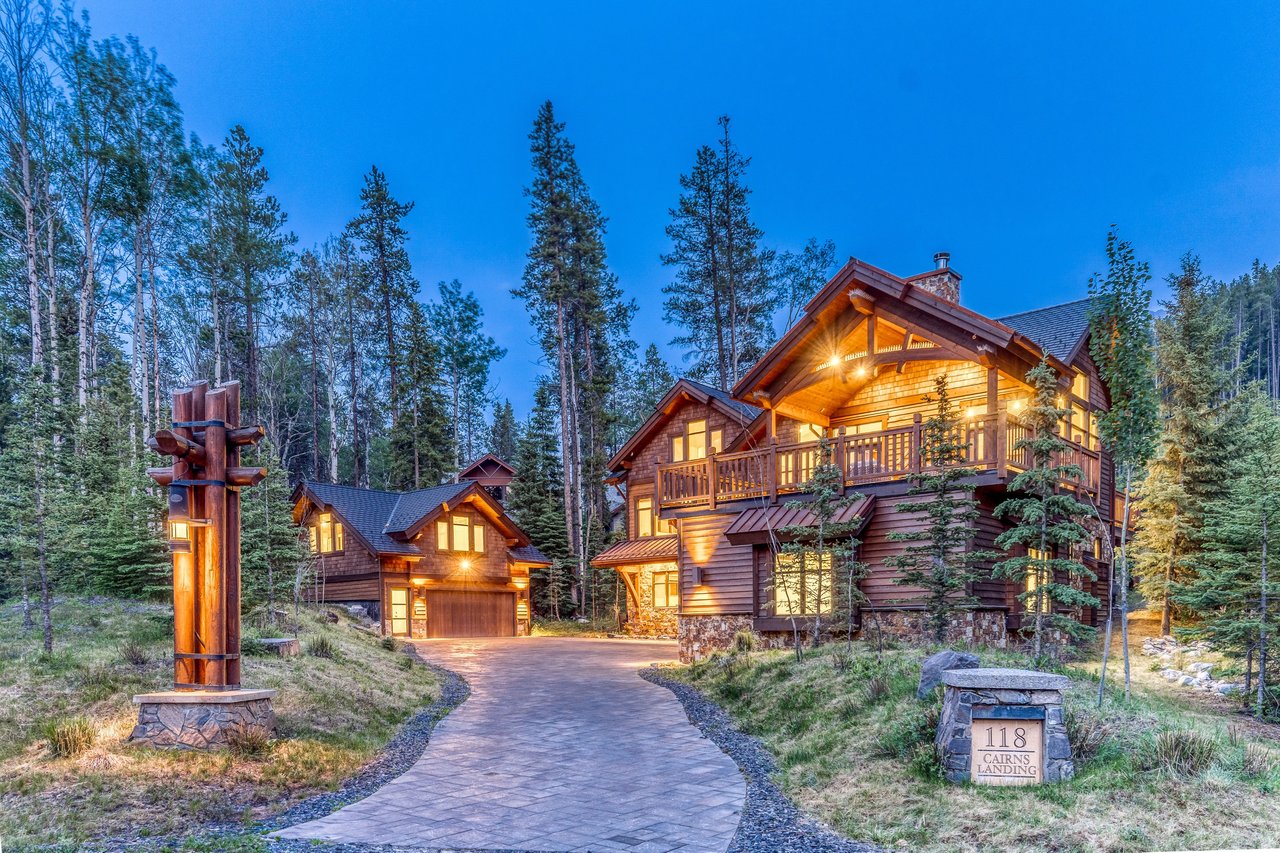
The luxury home market continued to show strength this year with some record-setting sales. New and newer construction luxury homes are consistently selling in the $1,000 / sqft range in the Valley bottom and Silvertip. With the release of lots in Silvertip, there will continue to be significant investment in custom homes in the community.
Q4 closed out the year with sales lower than 2020, 2021, and 2022 and higher than 2018 and 2019. With a return to a more stable market and lower inventory levels, sales returned to a more normalized level. December sales finished strong with sales increasing year over year and were steady month over month, while listings remain steady.
As we transition through the winter market, we expect to see active listing levels increase in the coming months. The spring market is historically a strong time for sales in the area with warmer days and more properties available.
Items to Keep an Eye On
- Foreign Buyer Ban – Likely not the effects the Government has intended. We have certainly seen buyers move to other resort markets or even the MD of Bighorn where the ban is not in effect. The other challenge has been owners who want to move within the market but are unable to.
- Three Sisters Mountain Village – the approval of both the area structure plans by the Town Council will likely see new products becoming available to the market in 2025. This is a multi-decade project and will change Canmore. Even with future development, the multi-year nature of the development likely won’t affect our low inventories in the near to medium term.
- Palliser Lands ASP – A significant non-market and market development is going to take shape on the North side of the highway below Silvertip over the coming decade. Hopefully, this can put a dent in our need for housing for full-time residents of the area.
- Canmore Liveability Task Force – There are proposed changes coming to the council with regard to tourist homes and properties that are not primary residences. Council meets on January 9th. Link here.
- Interest Rates – with many of the big Canadian Banks anticipating rates dropping in mid-2024, we could see a strong late spring/summer real estate market.
- Continued positive net migration to Alberta – The success of the Alberta is Calling campaign and the lifestyle that Alberta offers will likely continue to lead to net positive migration to the province.
As an amazing place to call home either as a full or part-time resident, the Canmore real estate market offers dynamic opportunities but also requires careful consideration of risks and market dynamics. As local real estate professionals, we look forward to providing insight and guidance on the market.