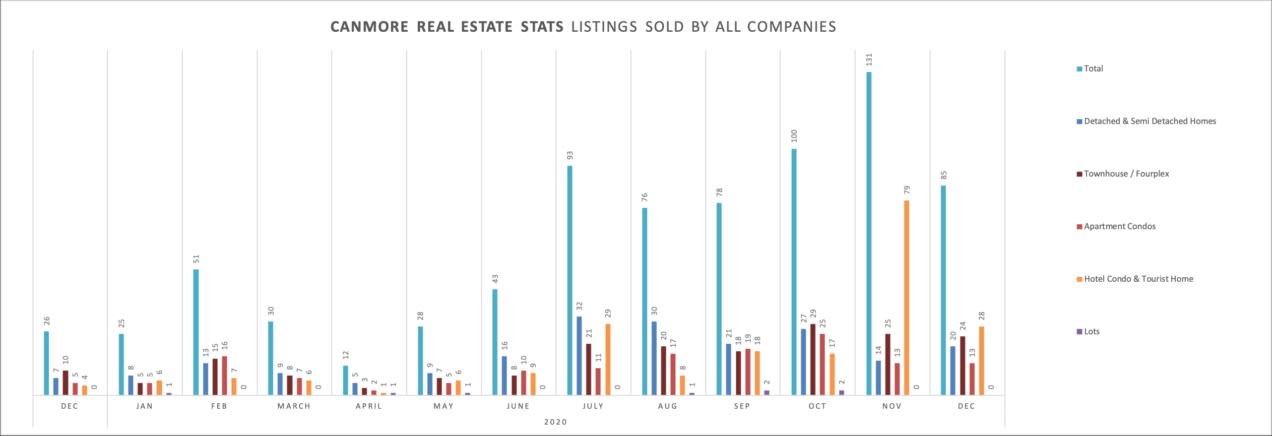
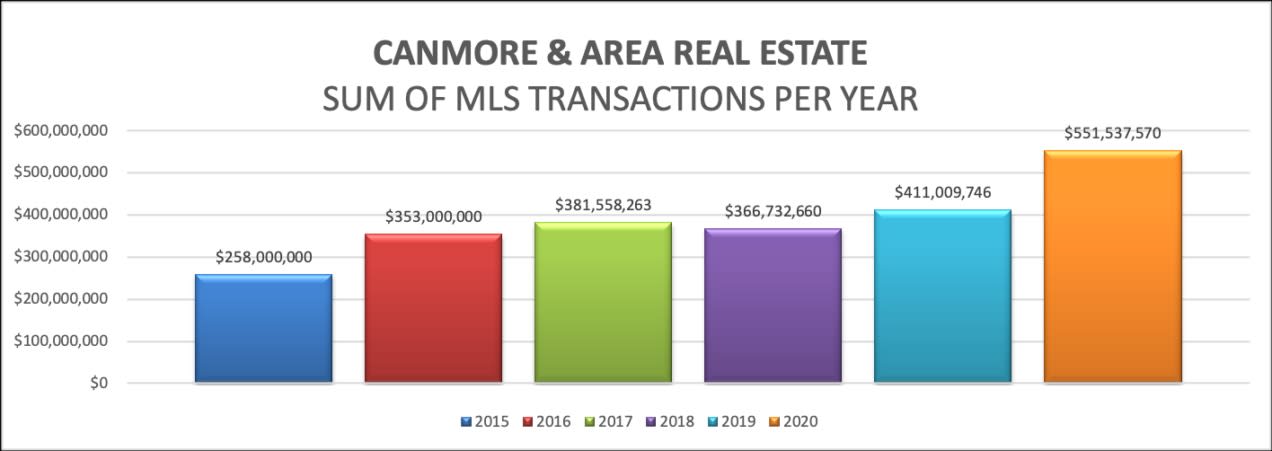
What started off as a strong year came to a screeching halt in the spring of 2020; looking back at our April news, we did not think we would be writing about a record-setting year for real estate in Canmore and the Bow Valley. In June once restrictions began to ease, we witnessed a surge of interest in real estate that continued through the end of 2020. There was $551,537,750 in MLS recorded real estate sales in 2020 a 34% increase year over year.
While we expected 2020 to be a strong year for real estate, the pandemic increased the desire to have a home in the mountains. Buyers this year were a combination of people moving within the market, people leaving urban markets, lifestyle buyers, investors, and foreign buyers.
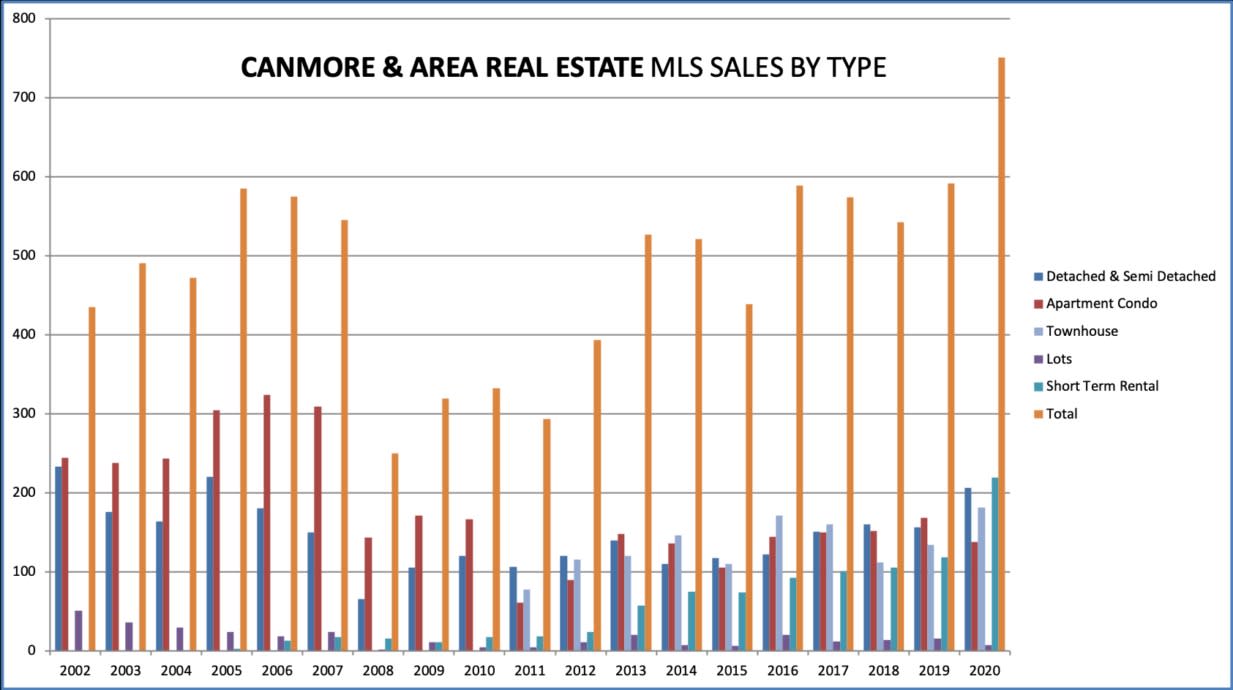
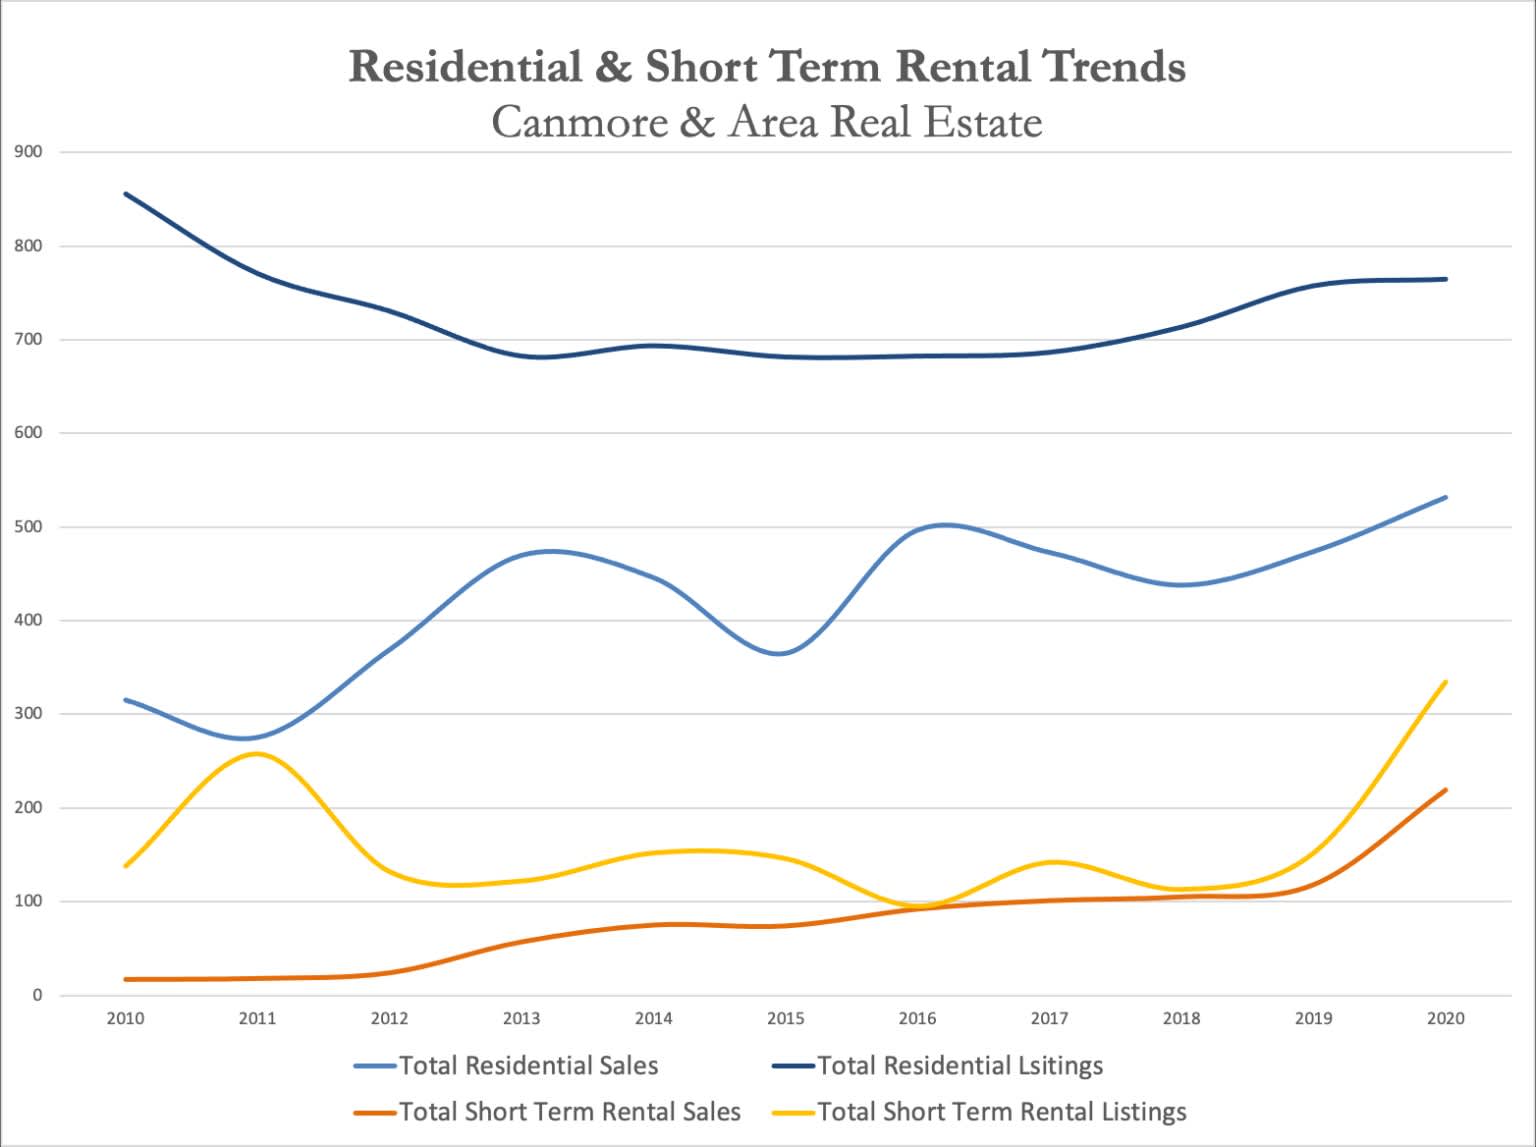
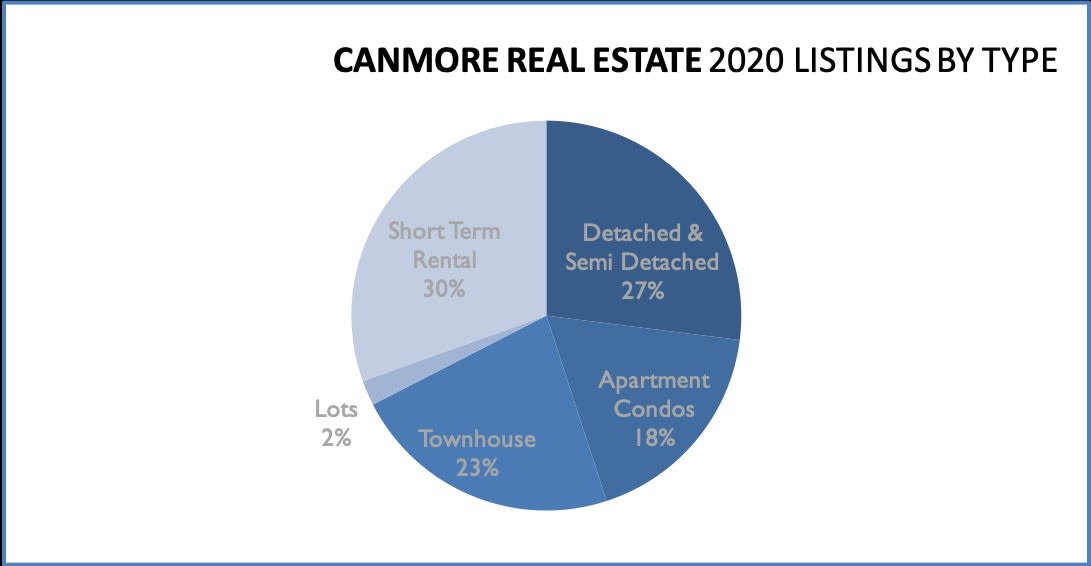
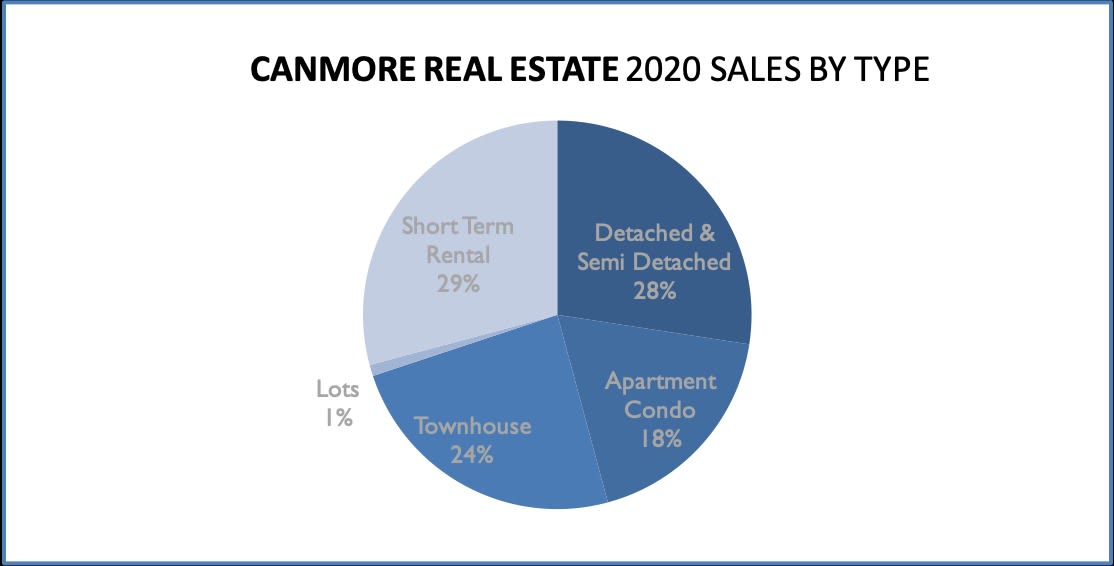
2020 had 751 MLS recorded sales in Canmore, Exshaw, Harvie Heights, Lac Des Arcs and Dead Man’s Flats; this is a 27% increase in sales volumes year over year! Detached and Semi-Detached home sales were up 32%, townhouse sales were up 35% and short-term rental properties were up an astounding 86%.
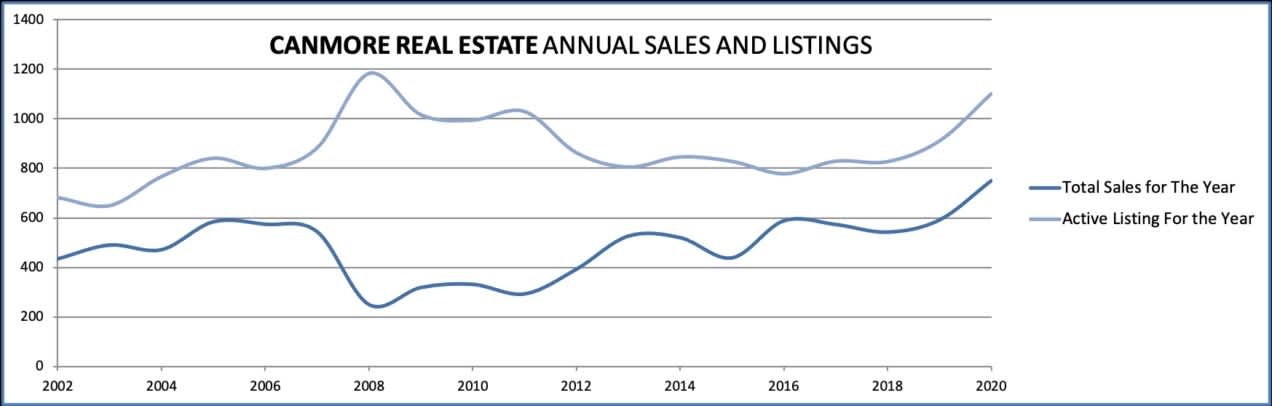
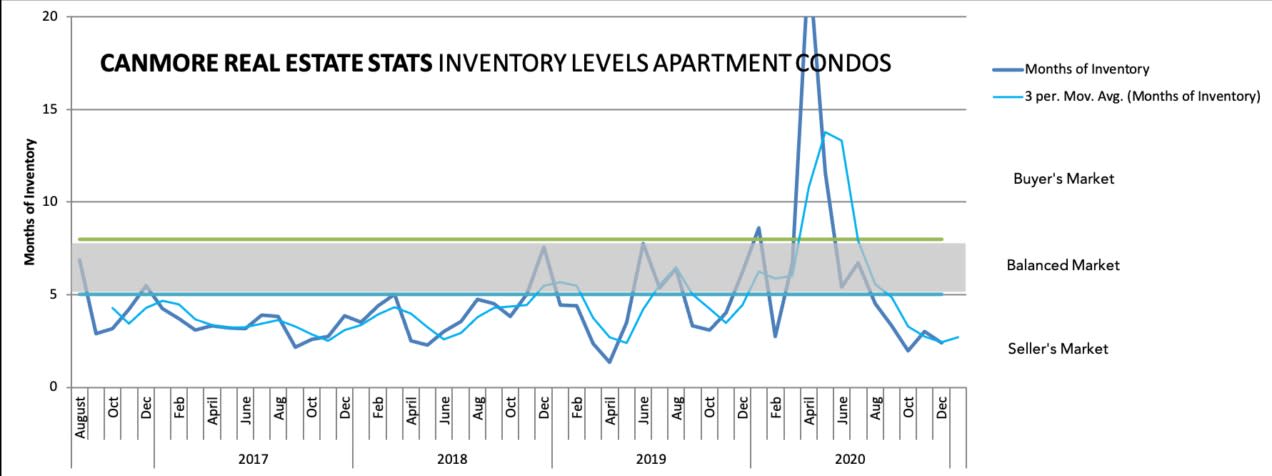
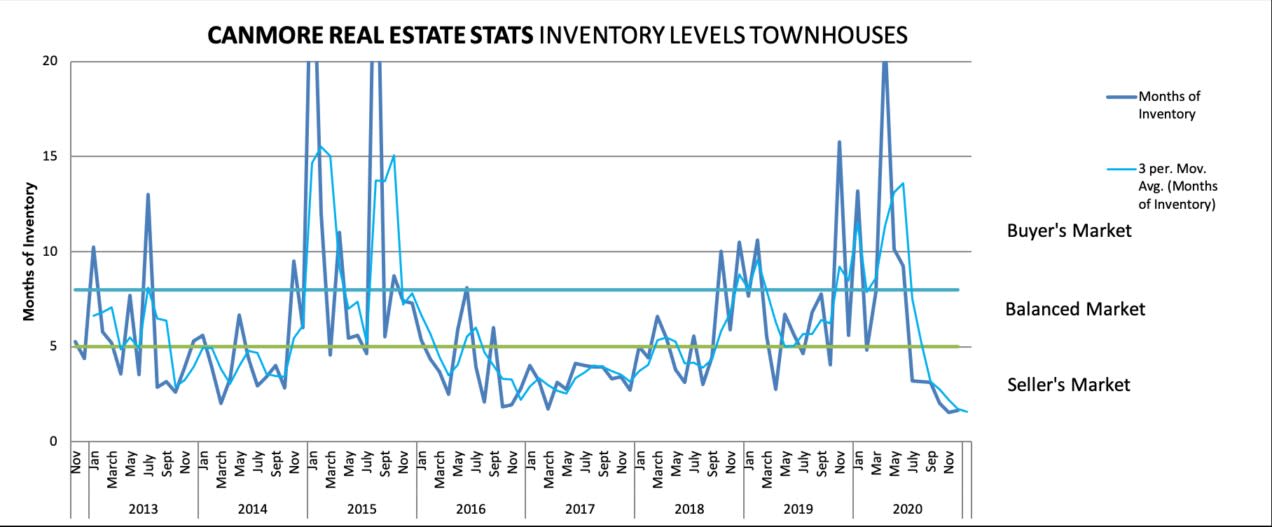
As we head into 2021, our active listings are nearing record lows with only two months of inventory. Year over year, January active listings are down 23%. Since September of 2020, active listings have declined by 47%. Heading into the spring market, we expect to remain very much in a seller’s market in the near future. Anecdotally, January which is typically a quiet month is already shaping up to be a busy month for sales with continued pent-up demand.
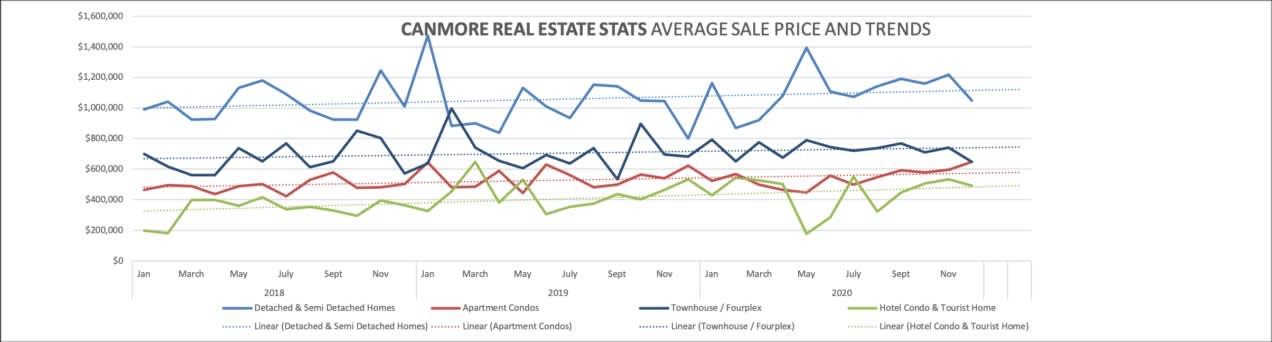
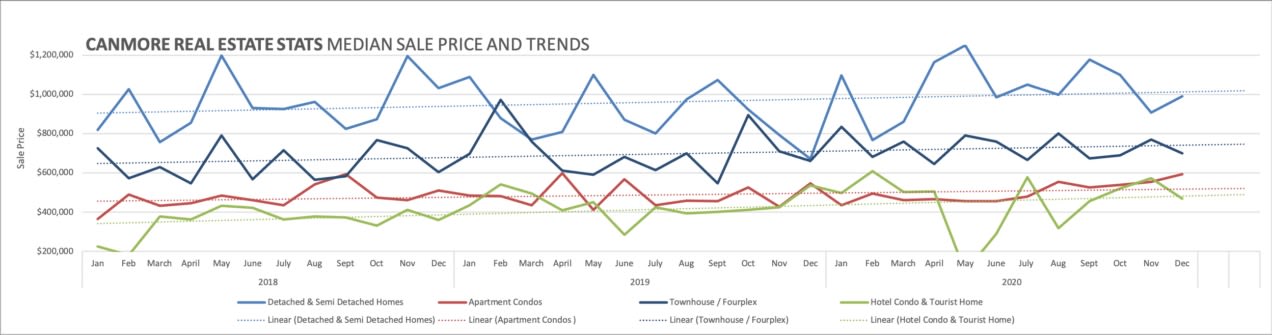
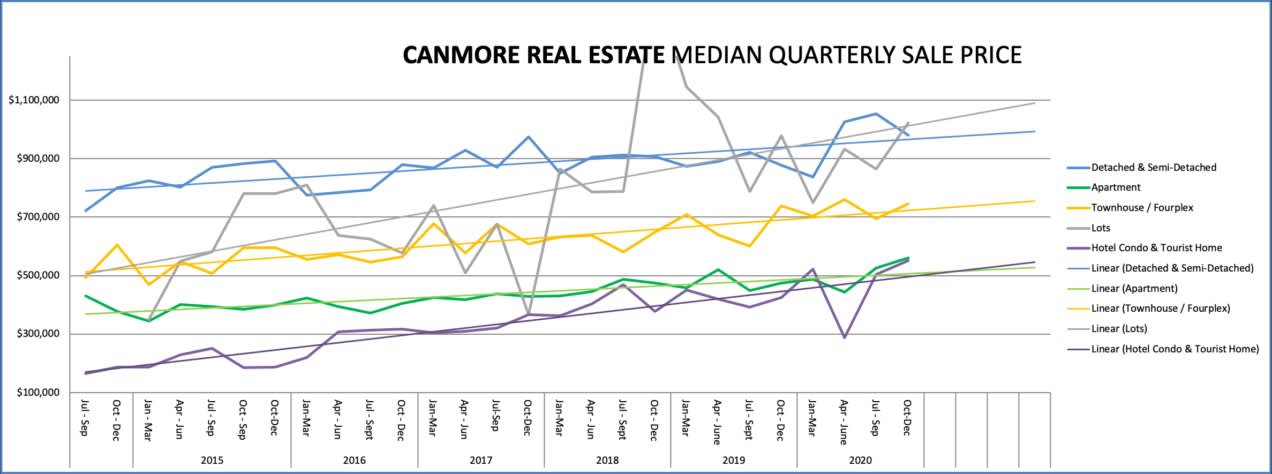
In general, we have seen both median and average prices increase in almost all segments of the market. Canmore and the Bow Valley have a wide selection of properties and averages/medians it is important to speak with your real estate professional about your property in terms of changes in value this past year.
Banff has been a different market than Canmore and the rest of the Bow Valley. Because of the need to reside and the singular nature of the economy, the real estate market in Banff has been slow. Since the fall, we have started to see sales pick up, but the recovery is not what Canmore has experienced.
A forecast for 2021… who knows! With extremely low mortgage rates, low inventory levels, continued interest and demand for recreational properties, the overall fundamentals of Canmore, and the eventual reopening of the US border, we anticipate another strong year for real estate. In particular, we expect to see the luxury segment of the market start to transact at levels not seen in years. Recently, there have been a number of sales in Silvertip where buyer and seller expectations have aligned and while sales prices are off from their former peaks, homes are selling. The new lots in Silvertip coming on the market will be a very hot product when they hit the market. In the luxury market, Canmore remains a very affordable community when compared to other resort communities in North America. Our access to Calgary, recreational opportunities, and location in Canada is going to make our community increasingly desirable.
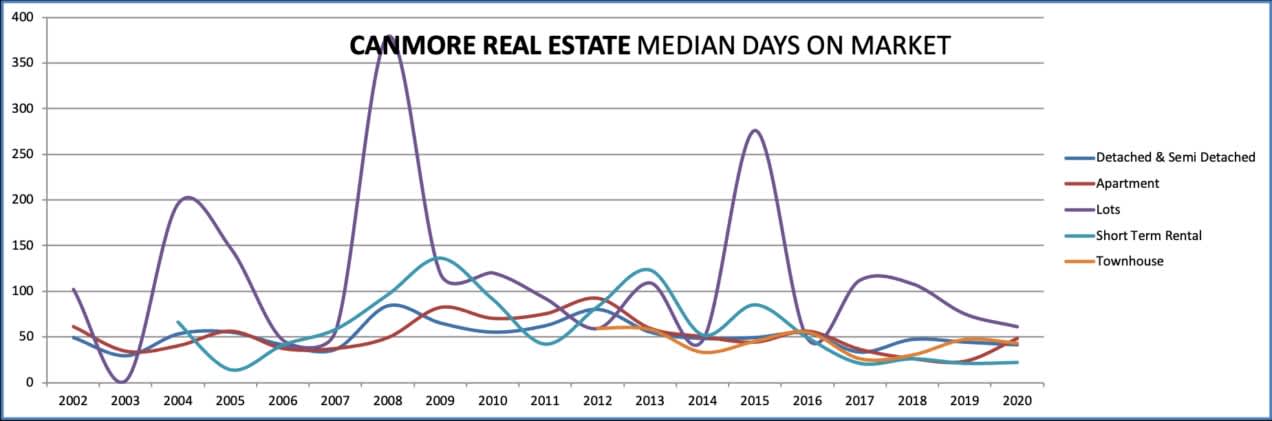
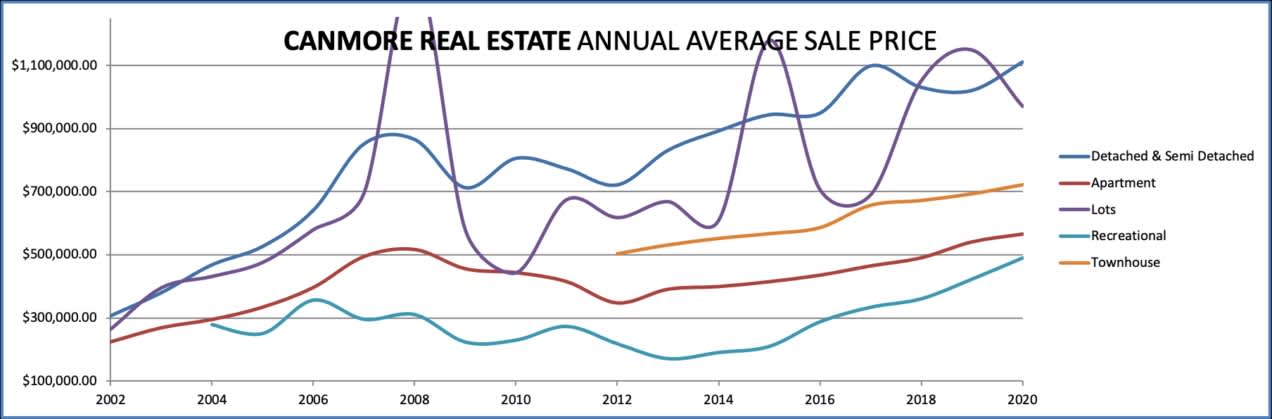
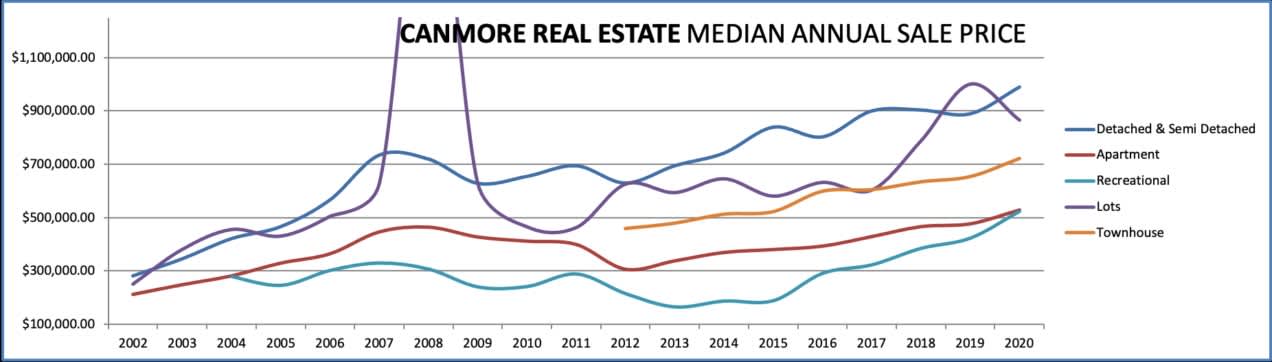
Detached and Semi-Detached Homes 2020
- 206 Sales ↑ 32%297 Listings ↓ 3%
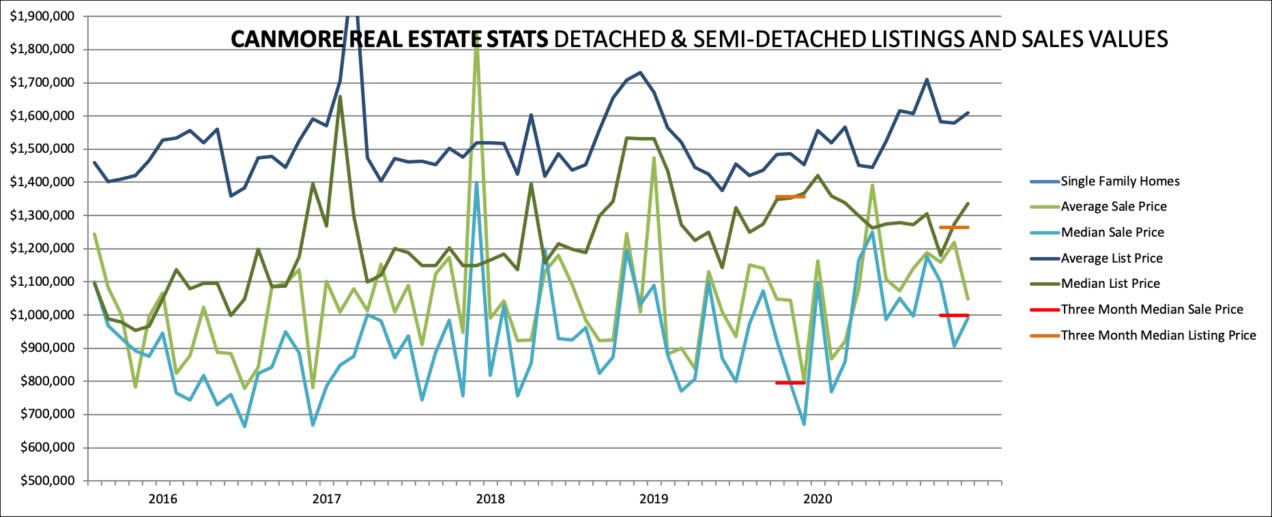
- $1,110,461 Average Sale Price ↑ 9%
- $991,000 Median Sale Price ↑11%
Detached and semi-detached home sales were very strong this year. We found that many buyers were looking for “move-in ready”, more space, and some outdoor living space. In the past, some of the buyers may have considered building but chose to go with a completed home.
Townhomes 2020
- 181 Sales ↑ 35%
- 247 Listings ↑ 17%
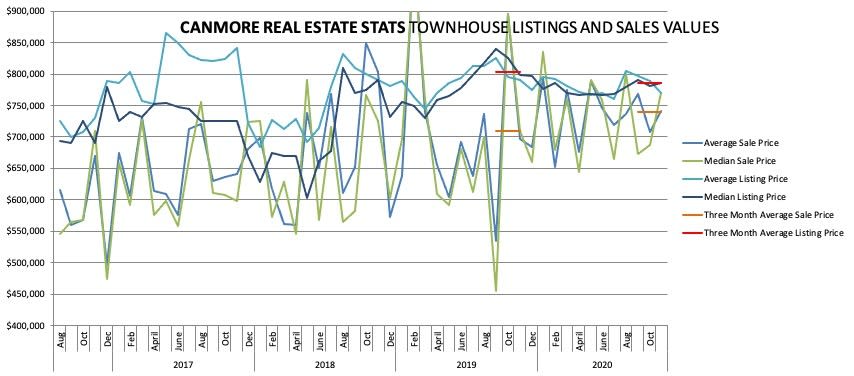
- $721,468 Average Sale Price ↑ 4%
- $723,000 Median Sale Price ↑ 10%
Townhome sales were again strong in 2020 as an affordable alternative to a detached or semi-detached home, while at the same time allowing for a lock-and-leave lifestyle. There were a number of new construction properties in both South Canmore and the Stewart Creek area of Three Sisters that sold out. We expect to see more townhome projects coming on the market in Three Sisters this year and more redevelopment projects in both Teepee Town and South Canmore.
Apartments 2020
- 138 Sales ↓ 18%
- 198 Listings ↓ 10%
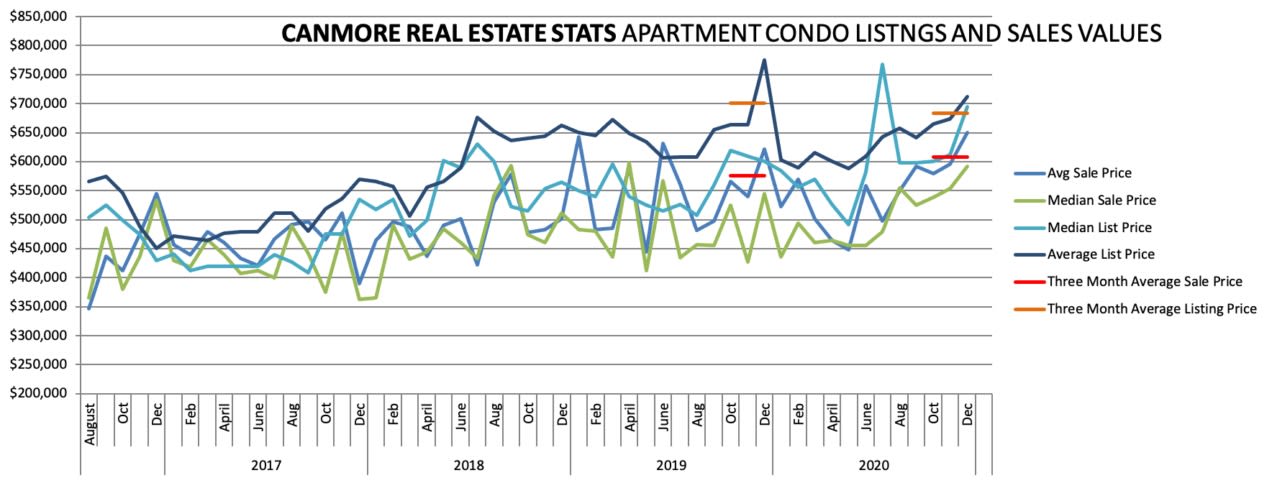
- $565,020 Average Sale Price ↑ 5%
- $529,500 Median Sale Price ↑ 10%
This year, we changed our statistics up as we are now more easily able to determine tourist home use properties from apartment style. As a result, part of the increase in short-term rental statistics now has tourist homes, while a decrease in sales is reflected in apartments. Overall, apartment sales were a mixed bag. Luxury apartment sales did very well with the Pinnacle at Silvertip nearing being sold out and new construction at Spring Creek continued to sell very well, albeit not registered on the MLS. However, more entry-level properties did not have as strong sales as many buyers in this segment are employed in tourism and have either lost their income or are working reduced hours.
Lots 2020
- 7 Sales ↓56%
- 23 Listings ↑ 9%
- $970,914 Average Sale Price ↓ 38%
- $860,000 Median Sale Price ↓ 14%
Canmore is running out of vacant lots and as such, sales declined. There are a handful of empty lots scattered around town currently. The most likely scenario for buyers looking to build are now redevelopment sites in South Canmore, Larch, and Lion’s Park. Silvertip has announced their upcoming release of development lots which we expect to go quickly once released. A future phase of Three Sisters Mountain Village will most likely have some development lots, but beyond that, Canmore is running out of land.
Short Term Rentals 2020
- 219 Sales ↑ 86%
- 335 Listings ↑ 120%
- $490,548 Average Sale Price ↑ 16%
- $523,950 Median Sale Price ↑ 24%
This is the first year we have compiled both tourist home use and commercial visitor accommodation use properties under the heading of short-term rental. 30 sales this past year were for tourist home-use properties. Short-term rental properties had an incredible year starting in June as sales took off. In particular, the new Basecamp Resorts project was pre-sold at the corner of Kananaskis Way and Bow Valley Trail resulting in ~75 new short-term rentals coming to market in 2022.